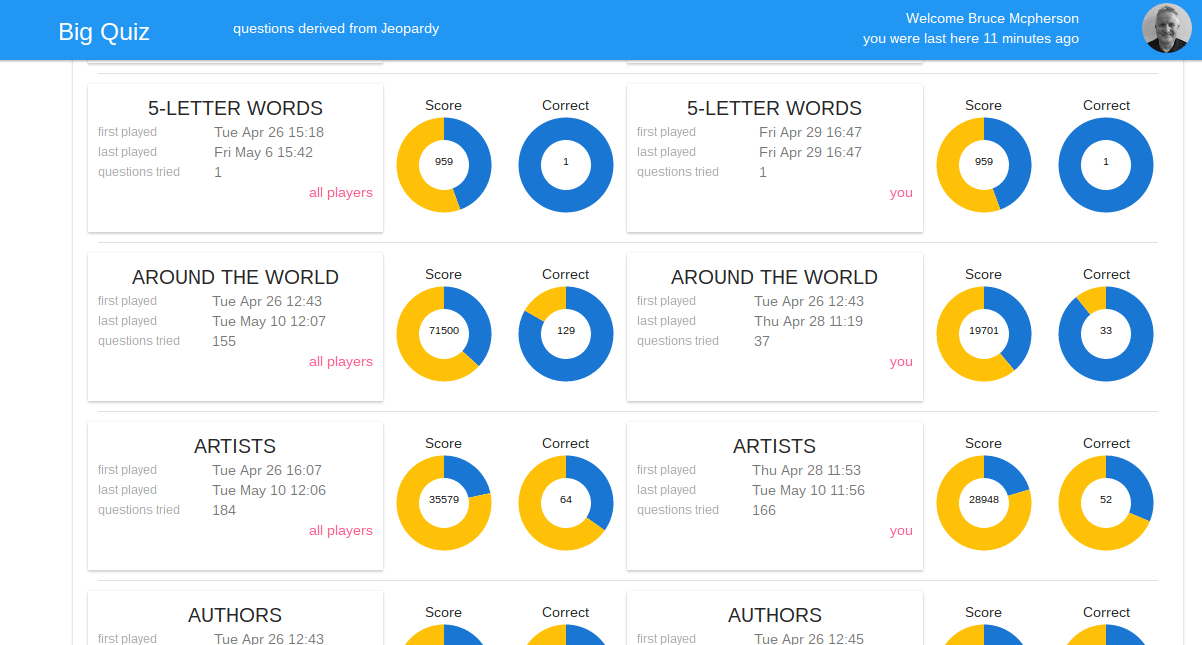
‘m showing score reports for the BigQuiz app. This is an individual players score compared to the maximum he could have got as well as the number of questions that were correctly answered, and also comparing that with all players. Try the App here. This a very simple visualization, and uses D3. However, it’s straightforward enough that I don’t need to even bother with creating D3 charts. I can just use the Configurable circular timer with D3 as described in Quick doughnut and pie charts with a radial timer. Here’s what they look like.
The code
You’ll find the code in the BigQuiz app on Github. For more like this, see Google Apps Scripts snippets.
Subpages
- BigQuery and the Execution API
- Configurable circular timer with D3
- Example of clock using d3 configurable timer
- Firebase custom authentication with goa
- Firebase JSON REST access library for Apps Script
- Quick doughnut and pie charts with a radial timer
- Sharing code between client and server and using libraries with html service
- Using the People API with Apps Script