What is this about?
If you want to press a button and include all the code you need to analyze your VBA code, this is what you need, and you can be up and profiling within a few minutes of downloading this free package. The automatic profiler will
- Allow you select some or all of your procedures for profiling
- Automatically insert (and remove) profiling code
- Produce reports for each of your profiled procedures that look like this
![]()
Download it here from the optimization section.
Other capabilities included in the package
Once you’ve analyzed your workbook for columns which are slow to calculate, and taken a look at Profiling your user defined functions , before you go the trouble of designing a focused profiler, this autoprofiler will get you up and running quickly to see where the choke points are.
Design Considerations
I had the following in mind while putting together this capability.
- Pick modules to be included through a form, and add profiling code based on that
- No manual changing of project at all
- Include as an add-in, not as part of your project, and dont add it to any menus or ribbons.
- Be able to analyze code and detect current autoprofile if present
- Remove all trace of profiling code automatically
- Still have access to the profling objects if wanted.
Generally speaking these have been met, except that you do have to add a reference to your project for it all to work. Once you have included the latest version of the profiler as an addin to your sheet, you will need to add the following reference to cpProfiler, through tools/references in your project VBE
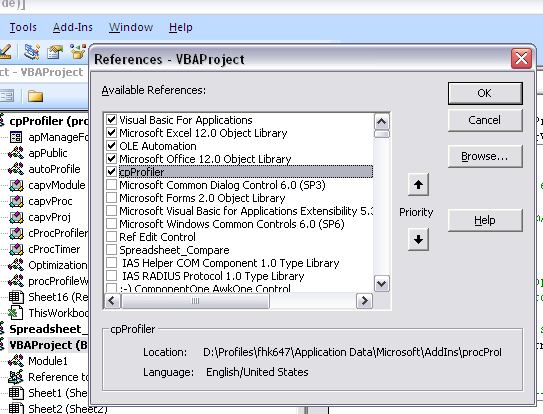
This is necessary to allow the autoprofiler to access classes in the add-in , which should show in your VBE as a separate project named cpProfiler. You will find the form to kick off the autoprofiling form in that project, under the apPublic module as below. I purposely did not add it to any menu bars in your sheet to keep it as clean as possible.
' -- execute this to get started---------------------
Public Sub autoProfileForm()
   apManageForm.Show
End Sub
If you execute this in code you will need to prefix the add-in project name as follows
Call cpProfiler.autoProfileForm()
AutoProfiling session example
I will not go into the details of the actual profiling here, as that has been all covered here. As usual we are trying to get a report on the activities of our procedures that would look something like this.
![]()
The first step is to introduce profiling code into your project, except rather than doing it manually we are going to generate profiling code and insert it into your procedures that will be executed alongside them. Whats required is
- The Project you want to profile
- The procedures that you want to include in that profile
- the ‘manager procedure’. This is the one that will wrap the other procedures and usually your main code. A manager procedure can also be profiled, for example if you only have one procedure of interest
- An existing output range to write the results to.
When you execute cbProfiler.AutoProfileForm, this form will arrrive

It will show all the modules in your project. You simply select the ones you want, choose the module that will be the ‘manager’, set the report range and ‘add autoprofile code’. This will introduce profiling code into the selected procedures. When you execute the manager module, profiler results will be written to the range you have specified as per the example earlier. You can format that area as you wish, using the example as a guide. The profiler does not touch the cell formatting in case you want some particular level of accuracy, date format etc…
What gets inserted
If you have already used the profiler or read the previous section hopefully this will be familiar. Adding the autoptofile code changes a project from this
Option Explicit
Sub main()
    Dim i As Long
    For i = 1 To 1000
        Call mloop(i)
    Next i
End Sub
Sub mloop(i As Long)
    Dim z As Double, j As Long
    z = 1
    For j = 1 To 200
        z = (Sqr(z) + 0.01) * tloop(0.1 + Exp(Sqr(Sin(Sqr(Rnd(i)) * Cos(Rnd(i))))) * Tan(Sqr(Sin(Sqr(Rnd(i)) * Cos(Rnd(i))))))
    Next j
End Sub
Function tloop(z As Double) As Double
        Dim i As Long, x As Double
        x = 1
        For i = 1 To 100
            x = Sqr(x + 0.01) * (0.01 + Exp(Log(Sqr(z) * Cos(z) * Sin(z) * Tan(z)))) / (Rnd(i) + 0.01)
        Next i
        tloop = Sqr(x)
End Function
to this
Sub main()
    Call cpProfiler.apConstruct("apProfiler_1")    'apProfiler_1 :apr:mgr:0.2 on 7/21/2010 at 1:36:26 PM
    cpProfiler.apProfiler_1.StartProfiler "apProfiler_1"    'apProfiler_1 :apr:mgr:0.2 on 7/21/2010 at 1:36:26 PM
    cpProfiler.apProfiler_1.Start "Proc:main", "(Module1) Proc:main"   'apProfiler_1 :apr:slc:0.2 on 7/21/2010 at 1:36:26 PM
    Dim i As Long
    For i = 1 To 1000
        Call mloop(i)
    Next i
    cpProfiler.apProfiler_1.Finish "Proc:main"    'apProfiler_1 :apr:slc:0.2 on 7/21/2010 at 1:36:26 PM
    cpProfiler.apProfiler_1.FinishProfiler    'apProfiler_1 :apr:mgr:0.2 on 7/21/2010 at 1:36:26 PM
    cpProfiler.apProfiler_1.Results Range("'ResultsSheet'!$A$1")   'apProfiler_1 :apr:mgr:rng|'ResultsSheet'!$A$1|:0.2 on 7/21/2010 at 1:36:26 PM
    cpProfiler.apProfiler_1.DestroyTimers    'apProfiler_1 :apr:mgr:0.2 on 7/21/2010 at 1:36:26 PM
End Sub
Sub mloop(i As Long)
    cpProfiler.apProfiler_1.Start "Proc:mloop", "(Module1) Proc:mloop"   'apProfiler_1 :apr:slc:0.2 on 7/21/2010 at 1:36:26 PM
    Dim z As Double, j As Long
    z = 1
    For j = 1 To 200
        z = (Sqr(z) + 0.01) * tloop(0.1 + Exp(Sqr(Sin(Sqr(Rnd(i)) * Cos(Rnd(i))))) * Tan(Sqr(Sin(Sqr(Rnd(i)) * Cos(Rnd(i))))))
    Next j
    cpProfiler.apProfiler_1.Finish "Proc:mloop"    'apProfiler_1 :apr:slc:0.2 on 7/21/2010 at 1:36:26 PM
End Sub
Function tloop(z As Double) As Double
    cpProfiler.apProfiler_1.Start "Proc:tloop", "(Module1) Proc:tloop"   'apProfiler_1 :apr:slc:0.2 on 7/21/2010 at 1:36:26 PM
        Dim i As Long, x As Double
        x = 1
        For i = 1 To 100
            x = Sqr(x + 0.01) * (0.01 + Exp(Log(Sqr(z) * Cos(z) * Sin(z) * Tan(z)))) / (Rnd(i) + 0.01)
        Next i
        tloop = Sqr(x)
    cpProfiler.apProfiler_1.Finish "Proc:tloop"    'apProfiler_1 :apr:slc:0.2 on 7/21/2010 at 1:36:26 PM
End Function
“remove Autoprofile Code” restores it to its former state.
Profiled code
You will notice that there are various notes in the comments of each of the profiled lines. Do not modify these. When you start the form up again, the autoprofiler analyzes these to establish what you had previously selected and recreates your choices. These comments are also used to help clear autoprofiling code when no longer needed. You can get rid of all profiled code with the “remove autoprofile code” button on the form.
Access to profiling objects
The main objects created, below, are available to you for inspection or manipulation and can be accessed through cpProfiler.apProfiler_1, which is of class cProcProfiler
- cProcTimer– an instance of this class is created for every section
- cProcProfiler– an instance of this class is created for every profiler.
Occasions
where you might want to do this will be covered in a more advanced section. Note however that any code you add will not be cleared away by “remove autoprofile code
Download
All downloads are available here For help and more information join our forum, follow the blog or follow me on Twitter