Here’s a real example of using the ChromeTrace library to take a look at what a triggered task is up to, and examine what we can see in the tracing tool. I’m going to add some tracing to Update analytics batch code and the 6 minute limit
Here’s the code for one of the triggered functions before I add tracing
function preCachePlusOnes() {

    // get the parameters for this site
    var options = cSiteStats.getOptions('ramblings');

    // this is the site i'm working with
    var site = SitesApp.getSite(options.domain, options.site);


    // get all the pages on the site
    var root = getPages(site);

    // add plus 1 counts
    addPlusOneCounts (root,options,true);

}
- Create a trace object, We will make it global so I can use it inside functions later
var trace = new cChromeTrace.ChromeTrace().setAccessToken(ScriptApp.getOAuthToken());
- Add a trace round the whole thing
function preCachePlusOnes() {

  trace.begin ("preCachePlusOnes");
- I can report errors to the tracing utility, so we’ll catch them. Then first step is to time the setup stage
 try {
    trace.begin ("setup");

    var options = cSiteStats.getOptions('ramblings');
    var site = SitesApp.getSite(options.domain, options.site);

    trace.end ("setup");
- time how long to get all the pages on the site
trace.begin("getPages");
    var root = getPages(site);
    trace.end ("getPages");
- time how long to get all the plus ones, then finish with a success
trace.begin("addPlusOnes");
    addPlusOneCounts (root,options,true);
    trace.end("addPlusOnes");

    done ({args:{success:true}});
- and we’ll catch any error and report that too
}
  catch (err) {
    done ({args:{success:false, err:err}});
    throw err;
  }
- Close off the overall timer, and dump the results to a drive file
 function done (args) {
    trace.end ('preCachePlusOnes' , args );
    trace.dump ('/Published Scripts/analytics');
  }
}
Page Content
hide
What we get when inspected in Chrome
![]()
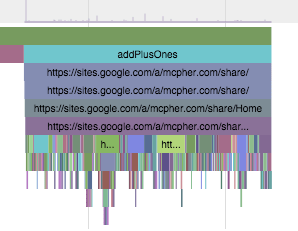
Let’s dig into the addPlusOnes function – this is recursive so it should be interesting to see how that works
function addPlusOneCounts (root,options,optCache) {

  root.plusOnes = canonPlusOnes ( root.getUrl() , options, optCache);

  root.children.forEach( function (d) {
    addPlusOneCounts (d,options,optCache);
  });

  return root;
}
Injecting some tracing gives this.
function addPlusOneCounts (root,options,optCache) {

  trace.begin (root.getUrl());
  root.plusOnes = canonPlusOnes ( root.getUrl() , options, optCache);

  trace.counter("recurseChildren",{args:{ childrenCount:root.children.length}});

  root.children.forEach( function (d) {
    addPlusOneCounts (d,options,optCache);
  });

  trace.end (root.getUrl());
  return root;
}
We can see a nice pattern of a site pages and its children, because of this
trace.begin (root.getUrl());

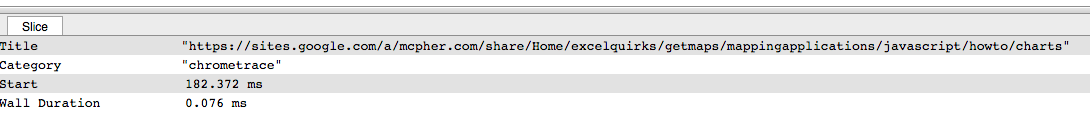
and tracing allows you to zoom in
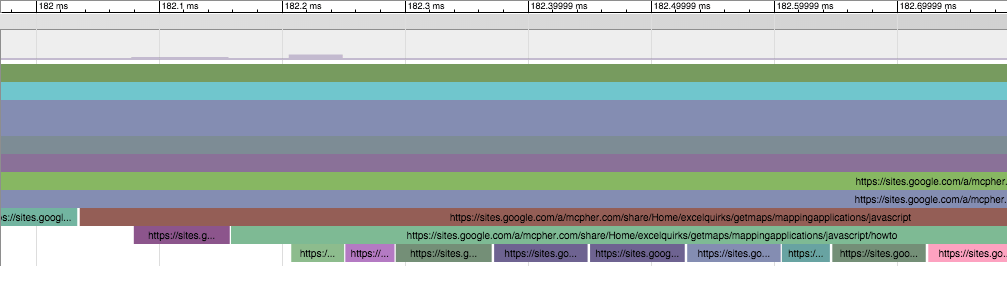
Click on some bar to get some details
Note also that we had a counter going
trace.counter("recurseChildren",{args:{ childrenCount:root.children.length}});
The light gray histogram at the top shows the counters
And we can click at any point in time to look at the counter

Logging errors
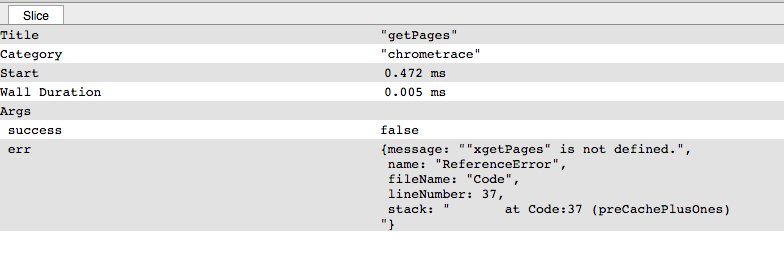
Let’s simulate an error and see what we get – it failed at the pink bar
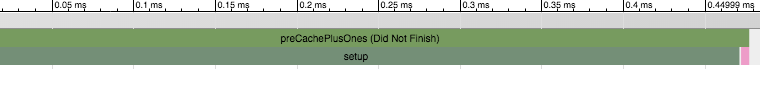
What’s interesting is that we have exactly the error logged
for help and more information, join our community, follow the blog and or follow me on Twitter. If you have any additional Chrome tracing types activated, pls let me know.