You’d think this would be easier than it turned out to be. I want to do this. In other, words to use a textPath to label up an arc, then to center that label. 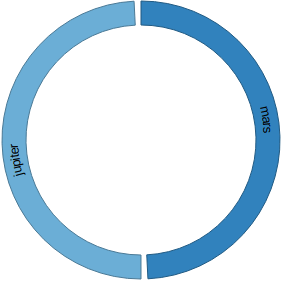 The obvious thing would be to use text-anchor, “middle” and startOffset 50%. In theory this should be all that’s needed. However it’s more complicated than that. Consider this snippet.
 var groupText = group.append("text")
      .attr("dy", (outerRadius - innerRadius) / 2 + 4)
      .attr("text-anchor", "middle");
    var groupTextPath = groupText
      .append("textPath")
      .attr("xlink:href", function(d) {
        return "#group" + d.index;
      })
      .attr("startOffset", "50%")
      .text(function(d) {
        return participants[d.index];
      });
For some reason, it does this instead.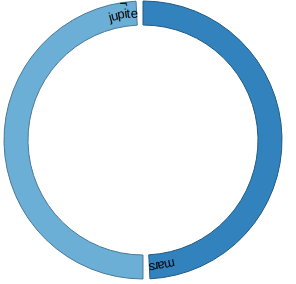 Now that I’ve figured it out it seems obvious, but at first I was pretty stumped. Here’s what’s going on. The path I’m using to plot the text against is this
<path d=”M8.511295254074105e-15,139A139,139,0,0,1,-6.947104528624411,-138.8262861949003L-5.74760446612811,-114.85627994542111A115,115,0,0,0,7.041719095097281e-15,115Z” id=”group1″ style=”fill: rgb(107, 174, 214); stroke: rgb(75, 122, 150);”></path>
..and of course its actually the entire segment, meaning it contains a line for the outer radius, plus one for the inner radius, plus another 2 to join the inner and outer radius of the arc. So when you use startOffset, it’s applying to the entire length of the path – not the length of arc- which is the path along which you’d like to create the textPath. A simple answer is to adjust startOffset to a smaller number than 50% to account for the fact that the path is more than twice as long as the one I want to use – so it should work out to something between 20 & 25%. Here’s the updated version which will calculate an approximate startoffset to center the text
 var groupText = group.append("text")
      .attr("dy", (outerRadius - innerRadius) / 2 + 4)
      .attr("text-anchor", "middle");
    var groupTextPath = groupText
      .append("textPath")
      .attr("xlink:href", function(d) {
        return "#group" + d.index;
      })
      .attr("startOffset", function(d) {
        var length = path.nodes()[d.index].getTotalLength();
        return (25-(50 *outerRadius)/length+(50 *innerRadius)/length) + "%";
      })
      .text(function(d) {
        return participants[d.index];
      });
The code
Here’s the complete example. Note that this uses d3 version 4, which is just out at the time of writing. Some of the syntax has changed between v3 and v4, so this code will only work on v4 as is.
function tryText() {
    var width = 286,
      height = width,
      outerRadius = Math.min(width, height) / 2 - 4,
      innerRadius = outerRadius - 24;
    var participants = ["mars", "jupiter"];
    var matrix = [
      [100, 200],
      [50, 250]
    ];
    var color = d3.scaleOrdinal(d3.schemeCategory20c);
    color.domain(participants);
    // the svg element for the diagram
    var svg = d3.select('#chart')
      .append("svg")
      .attr("width", width)
      .attr("height", height);
    // create the chords
    var chord = d3.chord()
      .padAngle(0.05)
      .sortSubgroups(d3.descending);
    // and the arcs
    var arc = d3.arc()
      .innerRadius(innerRadius)
      .outerRadius(outerRadius);
    // center the diagram
    var g = svg.append("g")
      .attr("transform", "translate(" + width / 2 + "," + height / 2 + ")")
      .datum(chord(matrix));
    // create g containers for the diagram compnents
    var group = g.append("g")
      .attr("class", "groups")
      .selectAll("g")
      .data(function(chords) {
        return chords.groups;
      })
      .enter().append("g");
    // plot the paths
    var path = group.append("path")
      .style("fill", function(d) {
        return color(participants[d.index]);
      })
      .style("stroke", function(d) {
        return d3.rgb(color(participants[d.index])).darker();
      })
      .attr("d", arc)
      .attr("id", function(d, i) {
        return "group" + d.index;
      });
    // whats the length of these paths ?
    console.log(path.nodes().map(function(p) {
      return p.getTotalLength();
    }));
    // but actually the path is two arcs + two verticals
    // so the actual length is
    // (length - ((outer-inner)*2))/2
    // so the startoffset, instead of being 50%
    // ((length - ((outer-inner)*2))/2)/length * .5
    console.log(path.nodes().map(function(p) {
      var length = p.getTotalLength();
      return ((length - ((outerRadius-innerRadius)*2))/2)/length * .5;
    }));
    var groupText = group.append("text")
      .attr("dy", (outerRadius - innerRadius) / 2 + 4)
      .attr("text-anchor", "middle");
    var groupTextPath = groupText
      .append("textPath")
      .attr("xlink:href", function(d) {
        return "#group" + d.index;
      })
      .attr("startOffset", function(d) {
        var length = path.nodes()[d.index].getTotalLength();
        return (25-(50 *outerRadius)/length+(50 *innerRadius)/length) + "%";
      })
      .text(function(d) {
        return participants[d.index];
      });
  }