This series of articles will work through how to create a connector for Data Studio in Apps Script. For an introduction into the structure I’ll be following see Creating a connector for Data Studio and for a walkthrough of the code see Coding a connector for Data Studio (without using data studio)
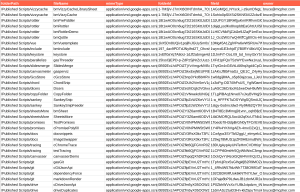
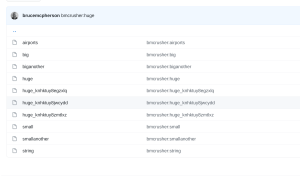
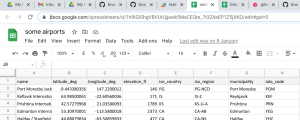
The source data will be the github apps script project catalog from Every Google Apps Script project on Github visualized . We’ll be using the Apps Script library that knows how to get the data from Apps Script projects on github. The live scrviz app can be found here . Now it’s finally time to get the connector wired up to Google Data Studio.
Attaching the connector By this time, we’ll have a working connector and checked what getData() is returning by using the connector as a library as described in Creating a connector for Data Studio so we won’t be wasting a lot of time trying to debug it from within Data Studio.
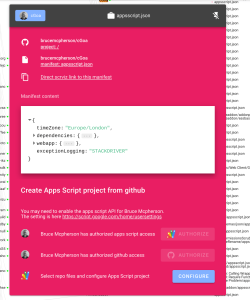
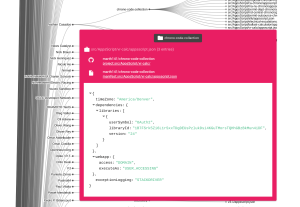
The manifest AppsScript.json needs to know things about your connector – here’s mine. Note the dataStudio section.
{ appsscript.json
Deployment The new IDE is actually less intuitive and useful than the old one in this respect – in the old IDE you just take the ‘deploy from manifest’ option and it tells you everything you need including a prebuilt Url to go straight to Data Studio.
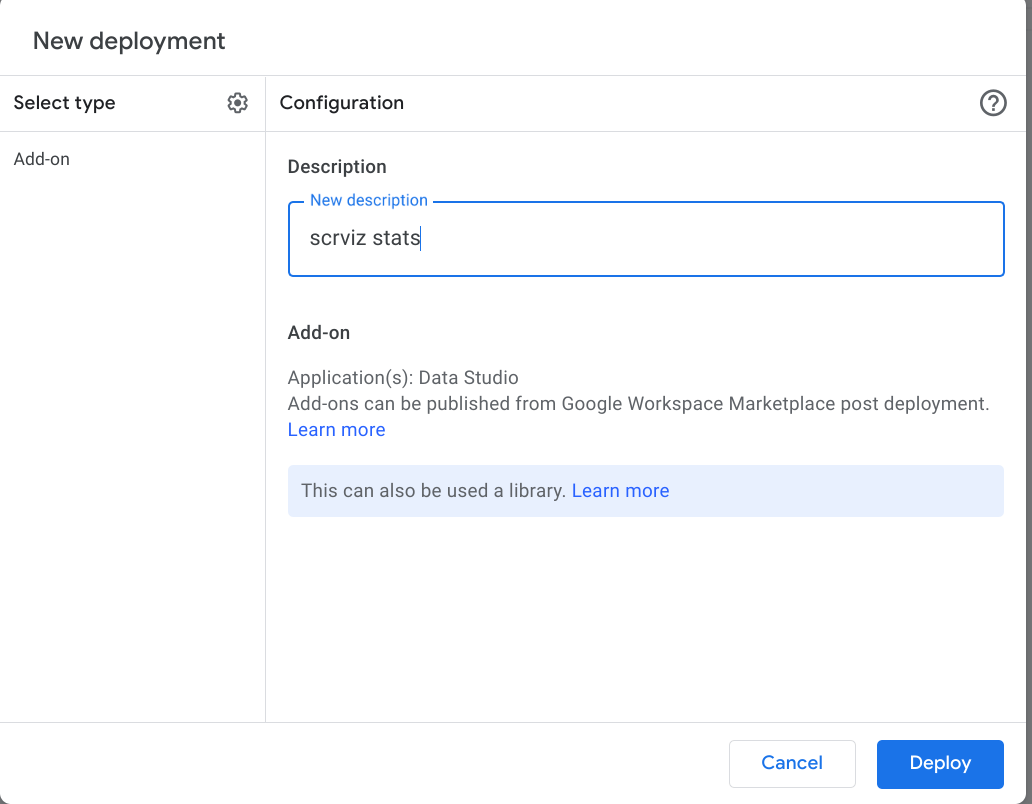
New deployment In the new IDE, pick Deploy, New Deployment and you’ll get this
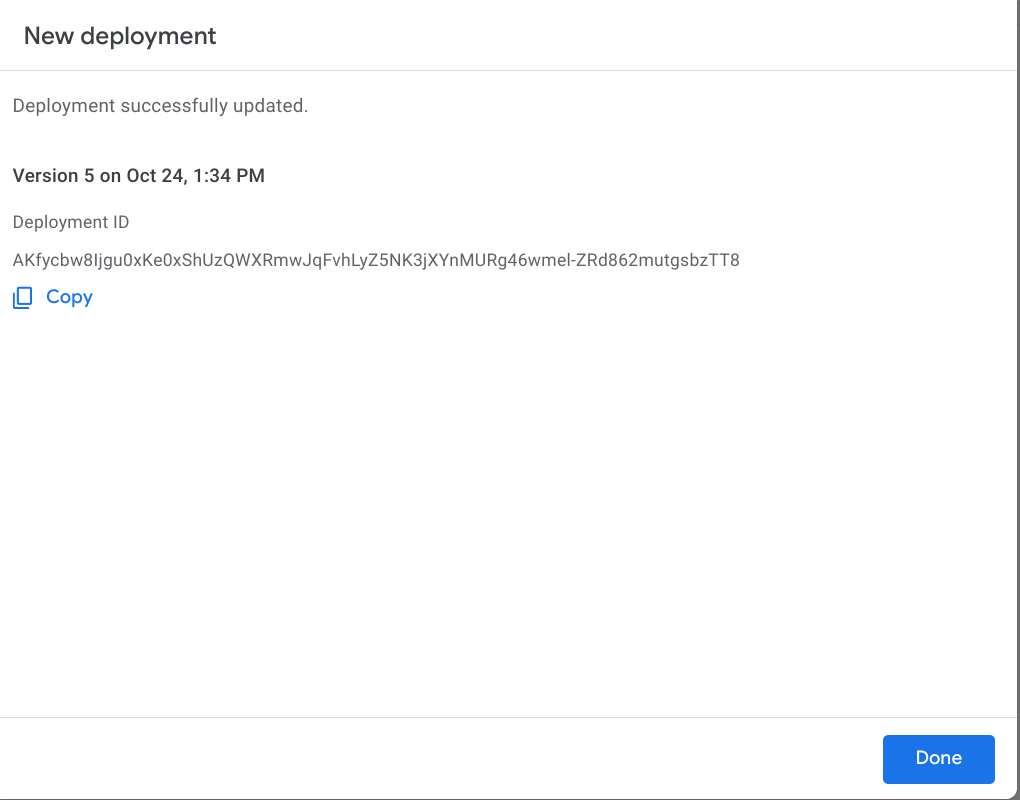
Deploy, and you’ll get this
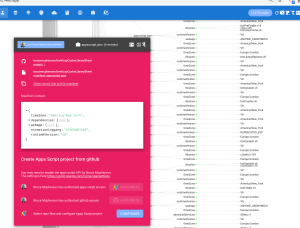
Connector URL You’re going to need that deployment ID to construct a URL like this
https://datastudio.google.com/u/0/datasources/create?connectorId=AKfycbw8Ijgu0xKe0xShUzQWXRmwJqFvhLyZ5NK3jXYnMURg46wmel-ZRd862mutgsbzTT8
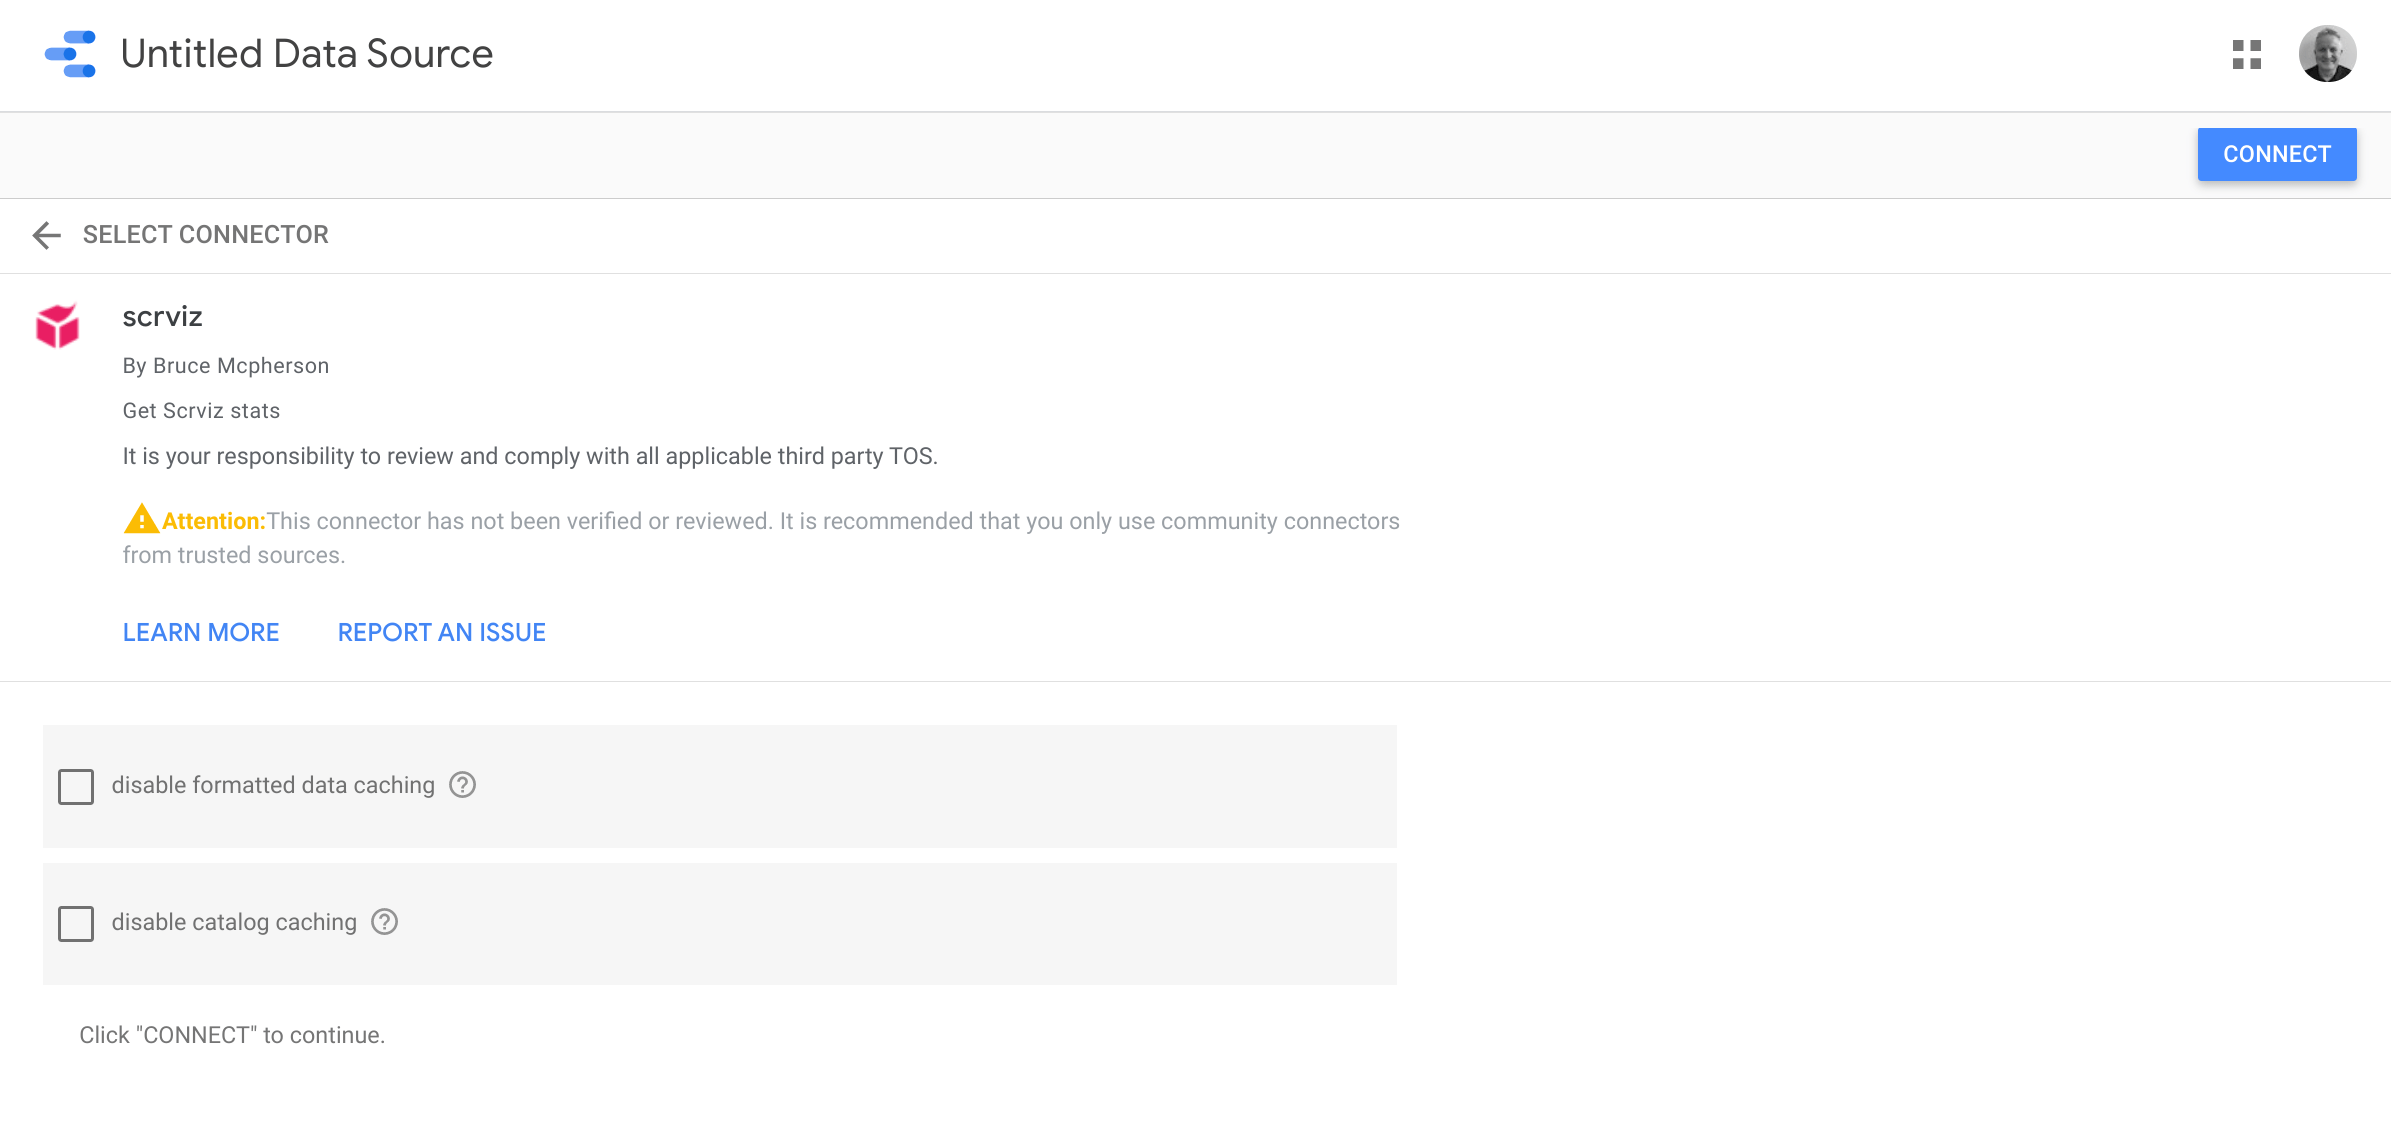
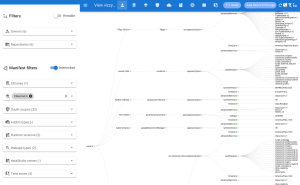
And you’ll end up here
Notice that the checkboxes from your getConfig() function are rendered.
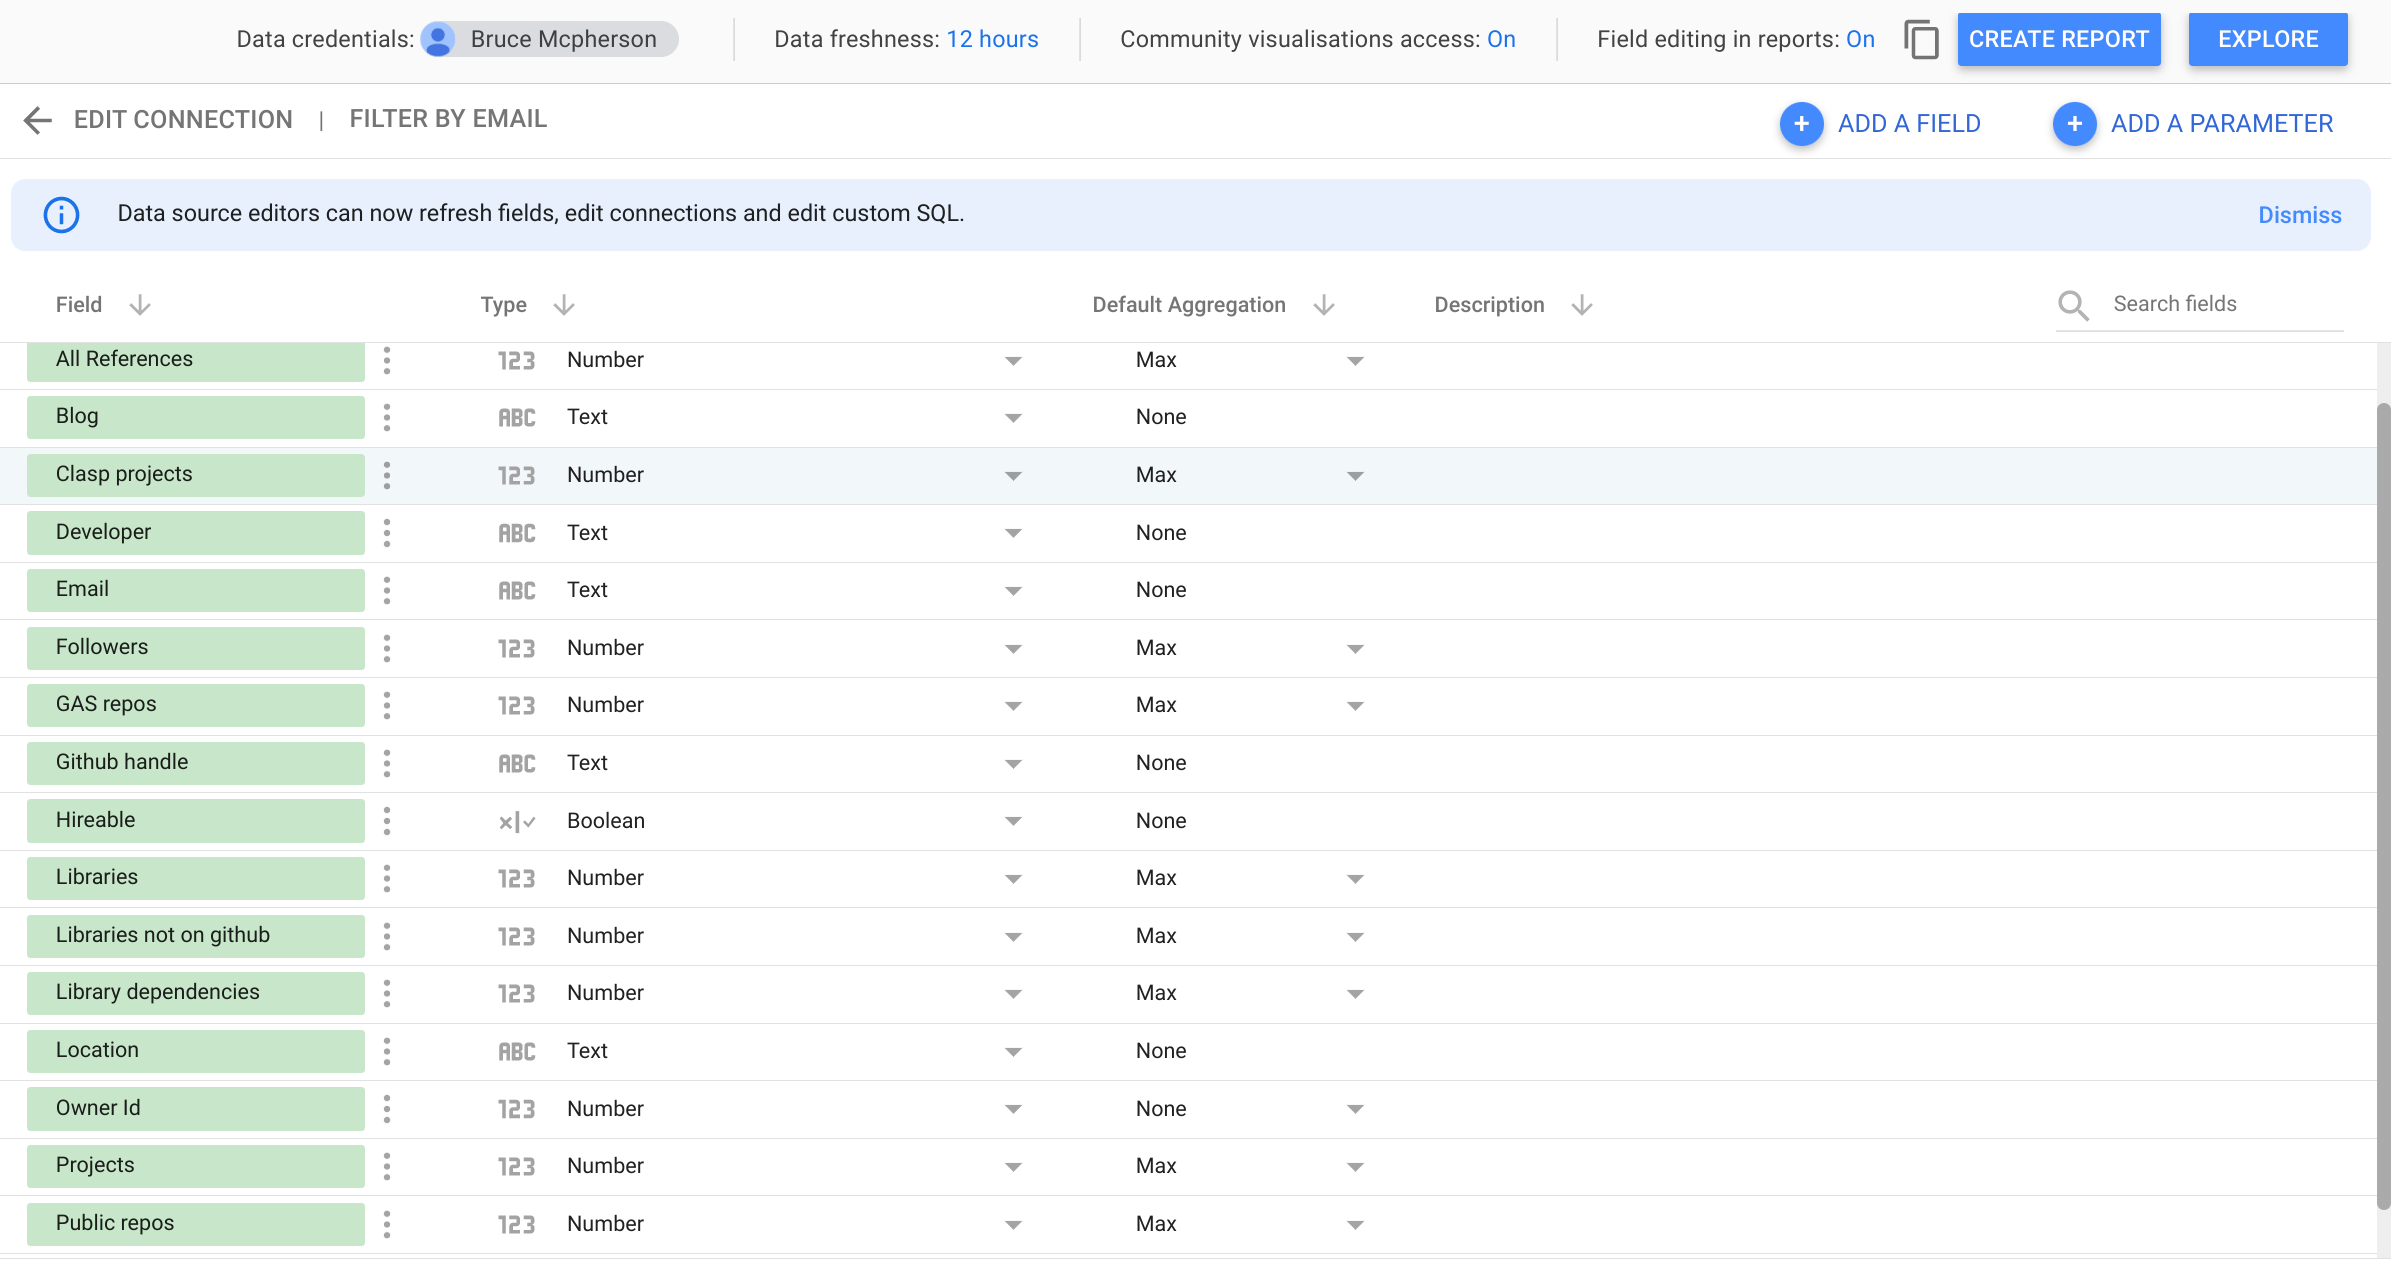
The fields Next we get to all the fields that were built in the getSchema() function
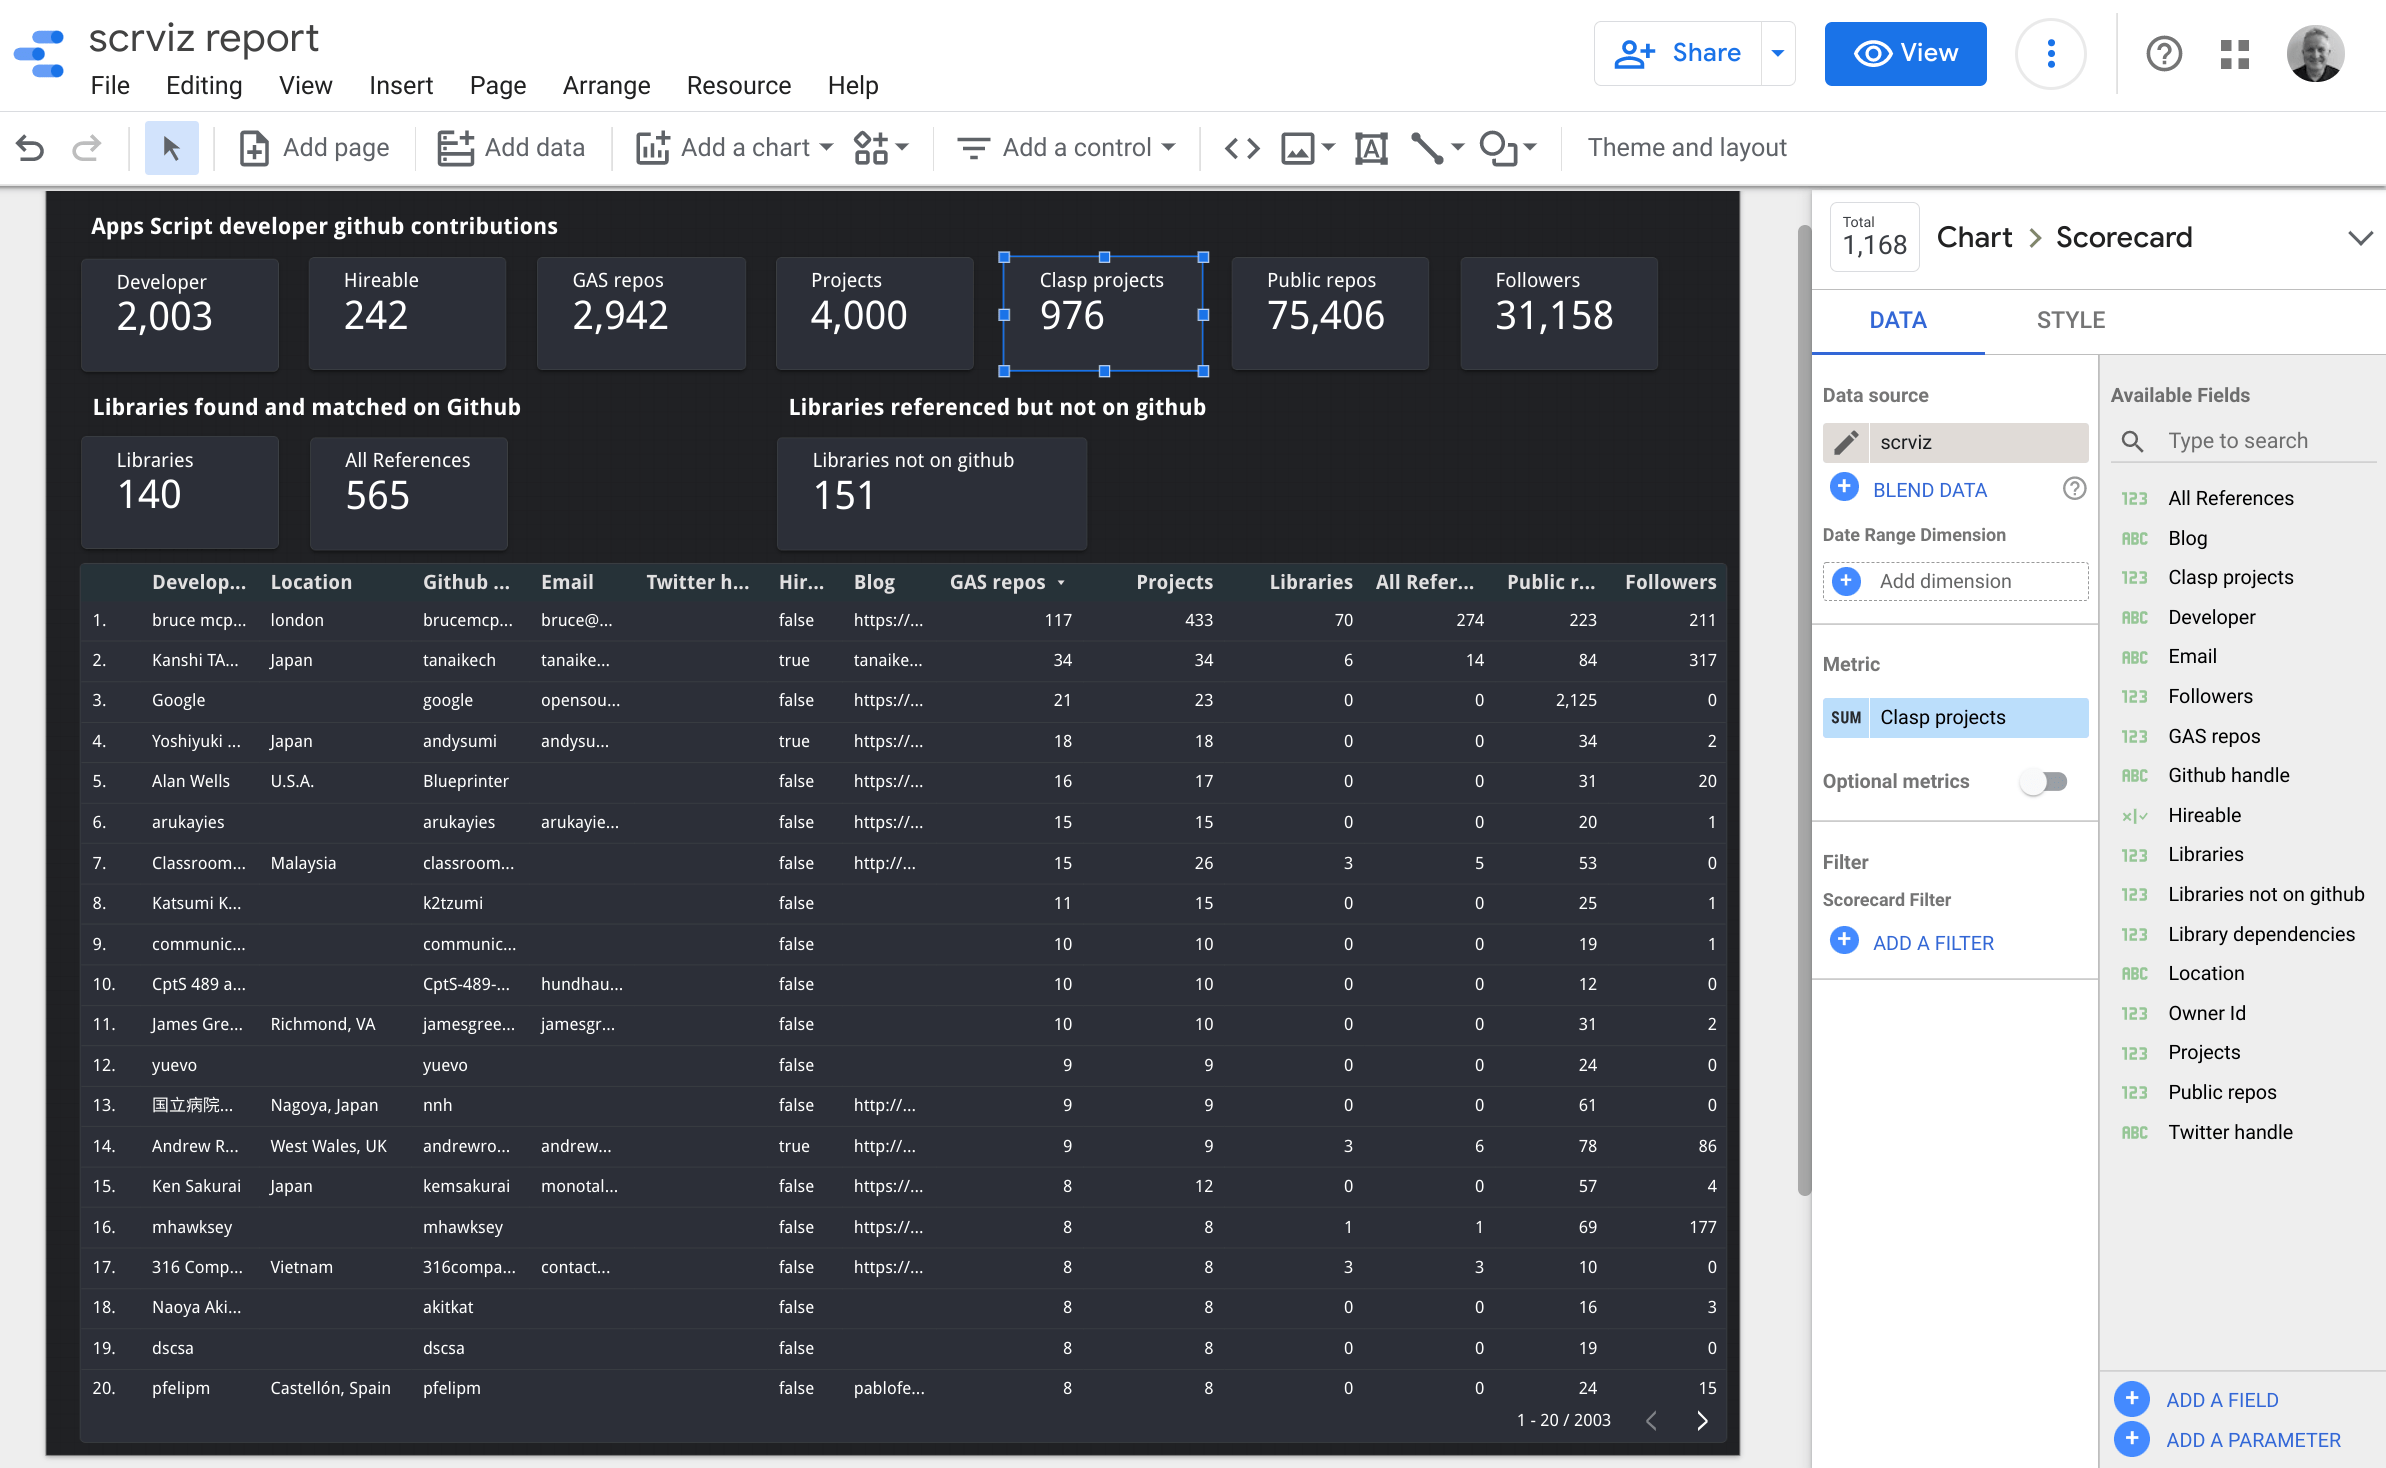
Create report Next we need to add charts to the canvas and assign the dimensions and metrics to them, selected from the fields returned by getSchema().
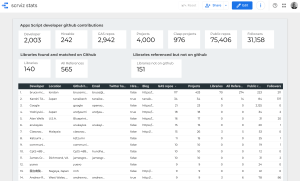
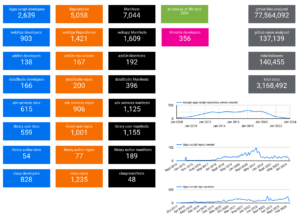
My simple report is just going to be a table and a collection of scorecards, so after a litle bit of theme tweaking, here it is.
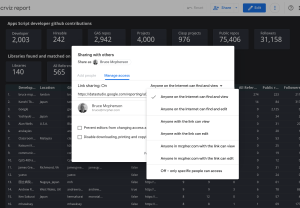
Sharing the report Open the view mode, and use share to get a link with the appropriate target. I’m making mine completely public
And here’s the link! – https://datastudio.google.com/reporting/a0f4a5d3-92f5-4411-b56b-e295a4796081
Summary That’s a wrap on my first Data Studio connector.
Here’s what I’ve learned
Caching wherever you can is very important if you have a large data set to handle. See the Digestive namespace in Coding a connector for Data Studio (without using data studio) for how to squeeze more into the Apps Script Cache Service
It’s a lot simpler if you forget all about data studio while developing the connector. Making it a library, and creating a test suite using the library for your getData() and getSchema() is a real timesaver
The new Ide deployment UX is pretty confusing, but stick with it. There’s no point in switching back and forwards (as I initially did)
I haven’t dug into Data Studio reports yet, as that’s a whole other topic for a different series of posts, so that’s all for this series.
Links Link to this report
https://datastudio.google.com/reporting/a0f4a5d3-92f5-4411-b56b-e295a4796081
Link to the datasource
https://datastudio.google.com/u/0/datasources/create?connectorId=AKfycbw8Ijgu0xKe0xShUzQWXRmwJqFvhLyZ5NK3jXYnMURg46wmel-ZRd862mutgsbzTT8
bmScrvizConnector
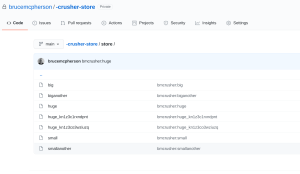
github: https://github.com/brucemcpherson/bmScrvizConnector
library key: 1sEEcPeh7GZ6QoGIRFP6rbbFU89SIM9DxPTO_bKbDIYWNFD1cZ5n6T3tK
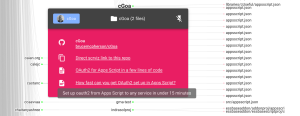
consumeScrvizconnector
github: https://github.com/brucemcpherson/consumeScrvizconnector
Every Google Apps Script project on Github visualized
VIDEO
This series of articles will work through how to create a connector for Data Studio in Apps Script. For an ...
This series of articles will work through how to create a connector for Data Studio in Apps Script. For an ...
This series of articles will work through how to create a connector for Data Studio in Apps Script. The source ...
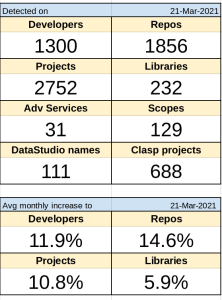
1000 pages and counting Most years I do a post on 'a year in Apps Script', looking back over the ...
Apps Script Vizzy update Every Google Apps Script project on Github visualized introduces a way of visualizing public Apps Script ...
A few years ago I released a visualizer of all the scripts that Google Apps Script developers have shared on ...
In Every Google Apps Script project on Github visualized I demonstrated an app that could be used to explore what every ...
Motivation There are so many Apps Script projects out there where the source code is published on Github, but it's ...
This page is still being written. In Pseudo binding in HTML service I showed how to simulate Sheets cell binding in an ...
Both Apps and Office offer the capability of adding extra functionality by bringing up some client side JavaScript which can ...
This series of articles will work through how to create a connector for Data Studio in Apps Script. For an ...
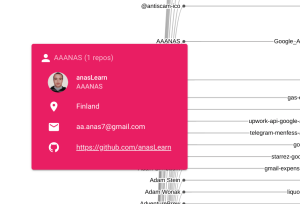
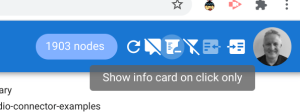
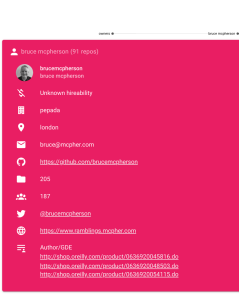
Info Card customization By default the info card appears when you hover over a node in the scrviz visualization. Although ...
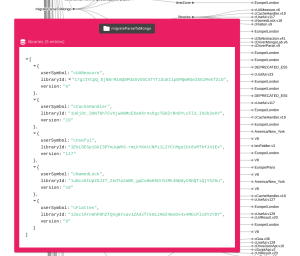
You want to include an Apps Script library, and you know it's name, but not its id. A pain right? ...
A few scrviz updates today, with more flexibility around the depth of the repo visualization and more options to enrich ...
In Enrich your developer profile on scrviz I showed how scrviz could be used to show off your Apps Script ...
In Showcase your Apps Script work and get hired via vizzy I showed how scrviz could be used to show ...
Motivation You'll know from Every Google Apps Script project on Github visualized that you can get a very large diagram of ...
Motivation Every Google Apps Script project on Github visualized describes how to use https://scrviz.web.app to find and visualize public Apps Script ...
A few years ago I released a visualizer of all the scripts that Google Apps Script developers have shared on ...
This piece of work to create inline libraries was both challenging and a lot of fun to produce, and it's ...
1000 pages and counting Most years I do a post on 'a year in Apps Script', looking back over the ...
This series of articles will work through how to create a connector for Data Studio in Apps Script. For an ...
This series of articles will work through how to create a connector for Data Studio in Apps Script. The source ...
In Every Google Apps Script project on Github visualized I demonstrated an app that could be used to explore what every ...
This article will cover the translation of the Sheets workbook filter type functions for Apps Script. All of them will ...
This article will cover the translation of the Sheets workbook database type functions for Apps Script. All of them will ...
This article will cover the translation of the Sheets workbook Array type functions for Apps Script. Most of them will ...
The method for doing this is actually part of the bmFolderFun library documented in A handier way of accessing Google ...
In Blistering fast file streaming between Drive and Cloud Storage using Cloud Run I showed how you could use Cloud ...
Sometimes you need to generate some fake data for a spreadsheet. In this post I'll cover a few utilities in ...
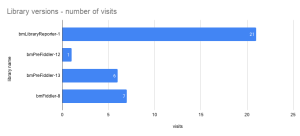
Motivation You've written a great Apps Script library and you want to know how many people are using it, and ...
Another quick demo of data sharing Here's a challenge that shares the data in a spreadsheet with node, set up ...
This is part of the series on sharing data between Apps Script and Node on various backends, Apps script library ...
Another quick demo of data sharing There are many ways to accomplish this of course, but using Caching across multiple ...
Quick demo of data sharing There are many ways to accomplish this of course, but using Caching across multiple Apps ...
Quick demo of data sharing There are many ways to accomplish this of course, but using Caching across multiple Apps ...
Github as an Apps Script cache platform Another plugin available for Apps script library with plugins for multiple backend cache ...
Upstash as an Apps Script cache platform Upstash is a brand new service offering a serverless redis over https via ...
Apps Script, Redis and GraphQL - together I'm a great fan of both Redis and GraphQL. You'll find plenty of ...
OneDrive as Cache platform In Apps script library with plugins for multiple backend cache platforms I covered a way to ...
Google Cloud Storage as Cache platform In Apps script library with plugins for multiple backend cache platforms I covered a ...
Motivation This library used to be part of my cUseful collection, but I've decided to pull out into a library ...
Motivation JavaScript authentication with Gapi is both impressive and frustrating. Frustrating because in most of the examples you come across, ...
Apps Script Vizzy update Every Google Apps Script project on Github visualized introduces a way of visualizing public Apps Script ...
Get yourself found as an Apps Script consultant Every Google Apps Script project on Github visualized introduced this vizzy app ...
In Every Google Apps Script project on Github visualized I introduced Vizzy which uses GitHub data as its source. That ...
In Every Google Apps Script project on Github visualized I demonstrated an app that could be used to explore what ...
Motivation There are so many Apps Script projects out there where the source code is published on Github, but it's ...