In Site data to sheets i showed how to get basic data from Analyzing site content with GAS into Excel and Google Sheets. To be able to use Excel tables to d3.js Force diagram, we are going to focus on massaging the data in Excel, then automatically creating a basic d3 force diagram. I’ve now enhanced this with a collapsible version, Focus node explorer with d3.js
Getting massaged data
We have to process the data a little beyond what is automatically possible using Rest to Excel library as in Site data to sheets. We can still use the same library entry, but instead we need to manually unravel the tag data as follows.
Public Sub testTagSiteJsonDetail()
    Dim cj As cJobject, n As Long, cc As cCell, jo As cJobject, _
        k As Long, jp As cJobject
    Application.ScreenUpdating = False
    Application.Calculation = xlCalculationManual
    With restQuery("tagsitedetail", "tagsitejson", _
        "0B92ExLh4POiZTFgwcWtXUG1qVU0", , , , , False)
        ' clear any existing data
        If (Not .dSet.where Is Nothing) Then .dSet.where.ClearContents
        For Each cj In .datajObject.children
            ' one for each page
            For Each jo In cj.child("tags.tagmap").children
                k = 0
                For Each jp In jo.child("counts").children
                    k = k + jp.value
                Next jp
                ' only if there is any data
                If k > 0 Then
                    n = n + 1
                    ' this will pick up the page info
                    For Each cc In .dSet.headingRow.headings
                        If Not cj.childExists(cc.value) Is Nothing Then
                            cc.where.Offset(n).value = cj.child(cc.value).value
                        End If
                    Next cc
                    ' and here is the tag info
                    .dSet.headingRow.exists("tag").where.Offset(n).value = _
                            jo.child("name").value
                    .dSet.headingRow.exists("count").where.Offset(n).value = k
                End If
            Next jo
        Next cj
        .tearDown
    End With
    Application.ScreenUpdating = True
    Application.Calculation = xlCalculationAutomatic
End Sub
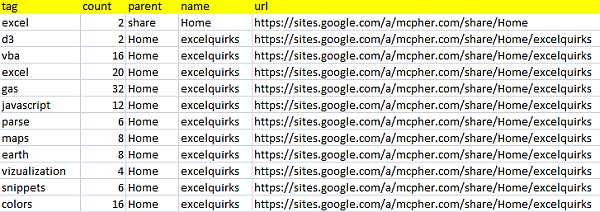
That gives us a dataset that starts like this
Creating the d3 force diagram
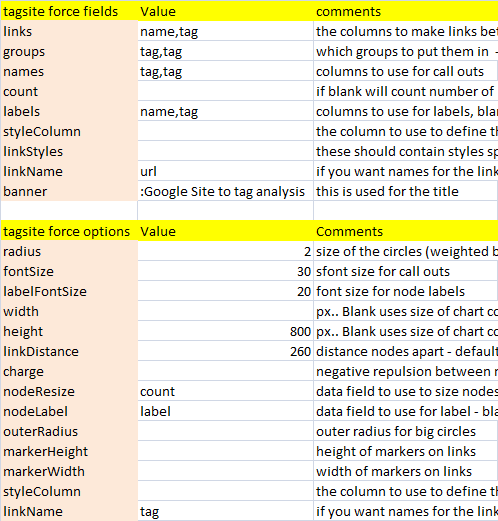
The data is now already perfectly set up to use Excel tables to d3.js Force diagram, so with a little tweaking of these parameters,
We get our first d3 viz of the google site. Here’s a snap
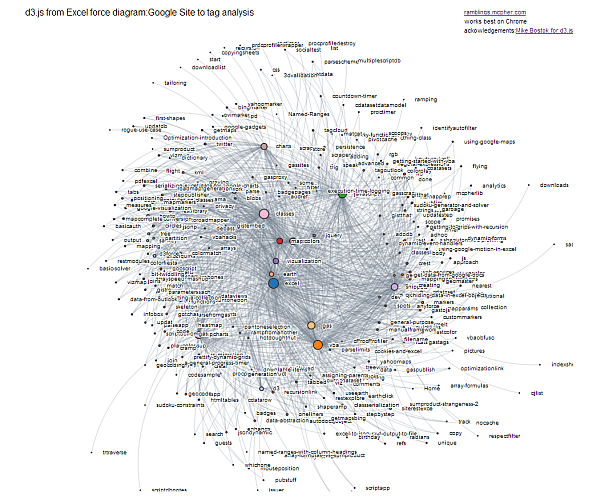
And for the non-browser challenged, here it is live
Next steps
So what does this show? I can see that javascript, vba, excel and classes are mainly what this site is about, with Gas not far behind. What’s more I can see links to all the pages that reference each topic. But it’s not yet what I had in mind. What I really want to be able to hide non-interesting topics and click on the pages that are linked to ones I’m interested in. That means I’ll need to implement collapsible force diagram next. See Focus node explorer with d3.js For more about this topic see Excel tables to d3.js Force diagram and GAS and sites