In Getting insights into Sheets performance I mentioned that I was taking a look under the covers of Sheets to see how performance is doing and introduced a useful function for timing stuff. The first thing to recognize though is that today’s Sheets performance is like night and day compared to the early days.
However, custom functions (which I tend to steer clear of) are still pretty poor. So what’s going on?
This small custom formula, which doesn’t call any services, and just does a little string manipulation shouldn’t take any time to run.
function nativeCapitalizeCallSign(callSign, name ) {
  return name.split(" ").map(function(d) {
    var com = d.slice(0,1).toLowerCase();
    return com[callSign.toLowerCase().indexOf(com) === -1 ?
      'toLowerCase' :
      'toUpperCase']() + d.slice(1);
    },[]).join(" ");
}
Using my timing function on a sheet I can test how long it takes to process called as a custom function
function timeCallSign (callSign, name) {
  var result = timeFunction (nativeCapitalizeCallSign , callSign, name);
  return [[result.start, result.finish, result.elapsed]];
}
and each cell had the formula, dragged down through a few rows.
=timeCallSign(A2,B2)
The results are below
| 1437738801681 | 1437738801682 | 1 |
| 1437738801347 | 1437738801347 | 0 |
| 1437738801086 | 1437738801087 | 1 |
| 1437738800794 | 1437738800795 | 1 |
| 1437738801077 | 1437738801077 | 0 |
| 1437738801836 | 1437738801836 | 0 |
| 1437738801603 | 1437738801604 | 1 |
| 1437738802069 | 1437738802069 | 0 |
| 1437738800956 | 1437738800957 | 1 |
| 1437738801046 | 1437738801046 | 0 |
| 1437738801378 | 1437738801378 | 0 |
| 1437738801289 | 1437738801290 | 1 |
| 1437738801730 | 1437738801731 | 1 |
| 1437738801590 | 1437738801590 | 0 |
| 1437738801691 | 1437738801691 | 0 |
| 1437738801733 | 1437738801734 | 1 |
| 1437738800946 | 1437738800947 | 1 |
| 1437738800660 | 1437738800661 | 1 |
| 1437738801395 | 1437738801395 | 0 |
| 1437738801774 | 1437738801774 | 0 |
| 1437738801825 | 1437738801825 | 0 |
| 1437738801901 | 1437738801902 | 1 |
| 1437738802077 | 1437738802078 | 1 |
| 1437738800701 | 1437738800701 | 0 |
| 1437738801377 | 1437738801377 | 0 |
As expected each function took 0-1 milliseconds to run, but overall the elapsed time on 25 rows was 1500 milliseconds, rather than 25 milliseconds
Plotting the start times of each function execution, I can see that mostly nothing was happening in terms of running functions. In fact I’ve had to exaggerate the dots which represent processing time, just to be able to see them
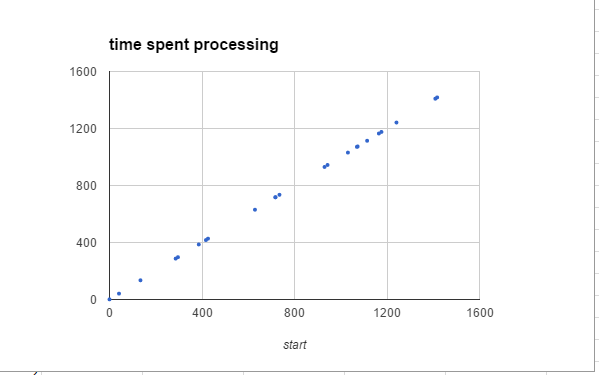
Clearly the execution time is not much to do with the custom function itself, but rather the server conversations needed to run each one.
Using Array formulas to eliminate processing gaps
Rewriting the custom function now to handle ArrayFormulas
function arrayCapitalizeCallSign(callSigns, names ) {
  // can handle either arrays or single arguments
  if ( !Array.isArray(callSigns) ) {
    return process (callSigns , names);
  }
  else {
    return callSigns.map (function (d,i) {
      return process (d[0], names[i][0]);
    })
  }
  // move out the processing to a function common arrays or single
  function process(callSign, name) {
    return name.split(" ").map(function(d) {
      var com = d.slice(0,1).toLowerCase();
      return com[callSign.toLowerCase().indexOf(com) === -1 ?
        'toLowerCase' : 'toUpperCase']() + d.slice(1);
    },[])
    .join(" ");
 }
}
And testing..
function timeArrayCapitalizeCallSign (callSign, name) {
  var result = timeFunction (arrayCapitalizeCallSign , callSign, name);
  return [[result.start, result.finish, result.elapsed]];
}
and calling it like this
=timeArrayCapitalizeCallSign (A3:A26,B3:B26)
The function only runs once, eliminating all those inter function delays, and does all the work in 6 milliseconds.
The lesson here is that you should always write your custom functions to handle array formulas (which will process a range all in one go), rather than calling the function repeatedly by dragging down a single cell formula.