What can you learn here?
- Create roadmaps
- Presentation quality
- Learn roadmap options

User Guide to Roadmapper – Get it now
Elsewhere on this site, I take you through the development of a roadmapper in Excel. Looking at the pattern of use, it seems that may visitors to this site just want a roadmapper to download and use (as opposed to following along with the creation of the VBA required to create one). This is a quick user guide for those that want to use the roadmapper right out of the box. I hope you find this free roadmapper tool useful – if so please +1 this site, join our forum, comment on the blog, follow me on Twitter etc. etc. If you show enough interest I will develop it further. You can download the Excel roadmapper here. Nowadays it’s in the cDataSet.xlsm workbook. There is also a Google Apps version.
Roadmap Example
Here is a roadmap created directly by the roadmap tool
 There are two simple pieces of information needed to be able to create this.
- Data. The data format required by the roadmapper is very straightforward and compact
- Parameters. This is an Excel Sheet that describes the formatting and behavior of the roadmapper. There is a default roadmap parameter sheet in the downloadable example
Data Format
This is the data that created the roadmap above. There is one line for each shape on the roadmap. If a callout is required it is described on the same row under the same row using the callout column. More about that later. In the following discussion, an item refers to the shape and data described by 1 row of this sheet. The columns don’t need to be in this order, and not all are manadatory. This uses the cDataSet data Abstraction library so the data is simply terminated by a blank line & blank column. 
Columns values
- Activate. The date the item starts. A blank date means start from the beginning of the roadmap
- Deactivate. The date the item finishes. A blank date means continue to the end of the roadmap
- Description. Any text here will appear on the roadmap shape for this item.
- ID. Each item must have a unique ID of some sort. This is referenced by the target column.
- Target. If an item, or series of items transition to some other thing (the usual purpose of a roadmap is to show this transition), the the target should contain the ID of the item it will transition to. For example, in the example above, the mac and netbook transition to the iPad.
- Custom. The roadmapper has standard default behavior set up in your parameter sheet. However you may want to customize this behavior for some or all items. This will allow you to change formats and shapes and many other options.
- Cost. The roadmapper is capable of producing an attached chart that shows the cost of a roadmap over time. This optional field allows you to provide costs if you need them that will be used in the cost of ownership chart.
- Callout. Sometimes there is not enough room to describe an item, or you need to call them out for special attention. If you have some text here, a call out including that text will be created using the parameters selected in the custom field to position and format the callout.
- Sequence. The roadmap can be sorted vertically in a number of ways, selectable in the parameter sheet. One of them is to use the sequence field which you can fill with whatever you like if you need a particular order that cannot be achieved using the normal sort options.
Parameter Sheet
This worksheet is divided up into sections, separated by a blank line. The parameter blocks can be in any order. Once you have set this up to reflect your ‘house style’, its a good idea that you try to stick to it. That means that all your roadmaps will have a simlair look and feel
Container Block
This sets up the default behavior for roadmap shapes and the roadmap container frame created against this parameter sheet 
Container parameters
- Left. Top, Width. These specify the placement and dimensions in pixels of the overall roadmap relative to the sheet it will be plotted on.
- Height. The height of a roadmap is determined automatically by its contents. The Height parameter is currently ignored, but in a future version will be used to scale all the objects on the roadmap to meet a target height
- Allow Expansion. Normally a ‘target’ will expand to accommodate all the items that are transitioning to it. If a target only has one item arriving, you may want to keep the target and the item the same size. Setting this to No will accomplish that. This is the default and can be overridden with a custom definition.
- Start at Notch. If you are using a chevron shape, or some other shape with a ‘tail’, this parameter allows you to fit them into each other. Setting this to Yes will accomplish that. This is the default and can be overridden with a custom definition.
- Data. This is the default container shape for a data item. You can set it to any of the valid shapes in the dropdown list.This is the default and can be overridden with a custom definition.
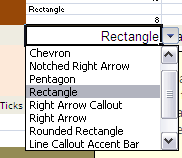
- Frame. This is the shape that goes round the entire roadmap. It has the same values as Data, above. You can also set the format column of this parameter to the format you would like to use for the background color, justification, text etc. of the frame. Just set it using the normal excel formatting tools and it will transfer that to the shape.
- Chart Ticks. As mentioned it is possible to create a cost of ownership chart. Right now this value only has one value – ‘same as roadmap’. In a future version this will allow a different granularity for the chart than the roadmap.
- Start Date, Finish Date. These are the dates that the roadmap should run from and to. If you select automatic, it will select suitable values based on the dates of the data and the tick scale selected.
- Ticks. This specifies the scale to use for ticks (dates to show along the top of the roadmap. If you select automatic it will choose something optimal based on the start and finish dates. You can also set the format column of this parameter to the format you would like to use for the background color, justification, text etc. of the frame. Just set it using the normal excel formatting tools and it will transfer that to the shape.

Options Parameter Block
These are parameters that refer to the behavior of the roadmapper in general. 
Options values
- Ignore. If this value is found in the Target Column it is treated the same as blank, meaning this item has no target
- Separator. This value is used as a separator in the Target Column. For example if the value was “big,small,medium” and the separator was “,”, then “big” would be treated as the target.
- IgnoreEmptyID. All items require a unique ID. If this is set to yes, then rows with no ID are ignored, otherwise an error is flagged.
- Allow Custom. If No, then any data in the custom column is ignored. If yes, then the custom parameters referred to by the custom name are used for this item.
- Chart Style. This defines the type of chart to use for the supplemental cost of ownership chart.

- Chart Proportion. Defines the height of the cost of ownership chart as a %age of the size of the roadmap
- Chart Cost Treatment. This defines how to treat the cost that is shown in the Cost column when including a cost of ownership chart.

- Output Style. For now the only valid value is Roadmap. In a future version there will be the possibility of exporting to other systems and formats.
- Mode. To create a roadmap, the only valid value is “Standalone”. The roadmapper logic has been embedded into other worksheets, for example to create roadmaps from a database. In that case this parameter is to be used to modify the behavior of the roadmapper logic so it knows it is being used in an embedded way.
- Sort Target Population. It is possible to sort the roadmap so that the targets which attract the most items appear closest to the top or the bottom.

- Sort Bars by. This allows you to select which column to use to sort the shapes within their respective targets. Original means the order they appear on the sheet. Duration is the calculated elapsed time of the item.

- Sort Bar Order. This defines the order of ‘sort bars by’.
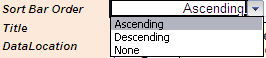
- Title. Will appear on the roadmap container.
- DataLocation. The name of the sheet that contains the input data
- Frameplot. The name of the sheet to write the roadmap to
- Respect Filter. Whether to respect any autofilter in place in the source data.
Custom Bars Parameter Block
This parameter block is used to describe custom shapes, and each row can be referenced by name in the Custom column of your data table. You can make as many rows as you like of these. Just copy and existing one, rename and modify as required ![]()
Custom Bar values
Each custom entry has these column values
- Custom Bar. The name by which to refer to this row in the custom column of your data
- Shape. The shape to assign to this item. Can be any of the known roadmapper shapes.

- Allow Expansion. Normally a ‘target’ will expand to accommodate all the items that are transitioning to it. If a target only has one item arriving, you may want to keep the target and the item the same size. Setting this to No will accomplish that.
- Gap. Space in pixels to allow vertically between shapes.
- Height. Height in pixels of the shape
- Start at Notch. If you are using a chevron shape, or some other shape with a ‘tail’, this parameter allows you to fit them into each other. Setting this to Yes will accomplish that.
- Chart Cost Treatment. This defines how to treat the cost that is shown in the Cost column when including a cost of ownership chart.
- Format. You can set the format column of this parameter to the format you would like to use for the background color, justification, text etc. of the shape. Just set it using the normal excel formatting tools and it will transfer that to the shape.
- Callout. This defines the shape to use as a callout for this item. None means no call out. Any known roadmapper shape can be used as a callout.
- Callout Position. This is the position relative to the shape, that the callout should be positioned at.

- Callout Format. You can set the format column of this parameter to the format you would like to use for the background color, justification, text etc. of the callout shape. Just set it using the normal excel formatting tools and it will transfer that to the shape.
- Callout % Height. The callout is placed this %age of the height of the item shape above it.
- Callout % Width. How wide to make the callout relative to the item shape.
Roadmap Colors Parameter Block
In the absence of custom formats, the roadmapper attempts to apply formats according to date. The reason for this is that often a roadmap is defining a temporary state and a final state. This block is a special kind of custom block that sets parameters according to date. If you do not specify a custom value in the custom column for a data item, these parameters will be used ![]()
Roadmap Color values
There are 3 status values for date aware shape parameters. ‘current’, ‘recent’ and ‘old’. Most of the entries are the same as for the custom rows, except for some date definitions.
- Roadmap Colors. One row for each of ‘current’, ‘recent’ and ‘old’.
- Format. You can set the format column of this parameter to the format you would like to use for the background color, justification, text etc. of the shape. Just set it using the normal excel formatting tools and it will transfer that to the shape.
- Decommission from/to. Any items that are deacrivated during the periods specified by these dates will be assigned the parameter values from this row.
- Shape. The shape to assign to this item. Can be any of the known roadmapper shapes.
- Allow Expansion. Normally a ‘target’ will expand to accommodate all the items that are transitioning to it. If a target only has one item arriving, you may want to keep the target and the item the same size. Setting this to No will accomplish that.
- Gap. Space in pixels to allow vertically between shapes.
- Height. Height in pixels of the shape
- Start at Notch. If you are using a chevron shape, or some other shape with a ‘tail’, this parameter allows you to fit them into each other. Setting this to Yes will accomplish that.
- Chart Cost Treatment. This defines how to treat the cost that is shown in the Cost column when including a cost of ownership chart.
- Callout. This defines the shape to use as a callout for this item. None means no call out. Any known roadmapper shape can be used as a callout.
- Callout Position. This is the position relative to the shape, that the callout should be positioned at.
- Callout Format. You can set the format column of this parameter to the format you would like to use for the background color, justification, text etc. of the callout shape. Just set it using the normal excel formatting tools and it will transfer that to the shape.
- Callout % Height. The callout is placed this %age of the height of the item shape above it.
- Callout % Width. How wide to make the callout relative to the item shape.
Executing the roadmap
In the example workbook, there is a button assigned to the procedure ‘roadmapper’. This will assume that the parameter sheet is called ‘parameters’. If you need to change any of that behavior you can modify some of the parameters in the vba module to whatever you need.
Modifying the data through the roadmap.
Clicking on any shape will bring up a form that will allow you modify the underlying data. This gets written back to the sheet and the roadmap is refreshed. If you just want to refresh the roadmap, click on the border of the roadmap frame. You can read how this is implemented at jSon and Dynamic Forms
Bringing up the data modification form

Roadmap Cost of Ownership chart
You will have seen this chart referred to in a the discussion on parameter sheets earlier. Here is a roadmap with such a chart appended. 
A note on copying and pasting
Ultimately, many of these roadmaps will be used in powerpoint or otherwise copied from Excel. To make this easier, all the shapes are grouped into one,so you can just select the roadmap frame and copy it. When you paste it to another office program, it comes across as grouped shapes so the can be manipulated as required, however to maintain recreatability, I recommend you simply get your parameters right and create the end product in Ecxel, then just paste it over as an image.
A google apps script version
There is also a Google Apps version. You can read about how that was developed here
Why not join our forum, follow the blog or follow me on Twitter to ensure you get updates when they are available. You can also submit anything you want considered for publication on this site to our forum. Now let’s look at Roadmap Generation and how this was made, or Download Complete Projects
Learning Apps Script, (and transitioning from VBA) are covered comprehensively in my my book, Going Gas – from VBA to Apps script, available