This is part of the Step by Step Guides to get started with some of the more complex topics on this site. The full story on marker quicklinks can be found at Quicklinks and Categories
What you need
GoogleMapping.xlsm from the Download Complete Projects page
Objective
To be able to hide or show markers according to a category on a map created according to How to put markers on maps
Steps
All Mapping activities, are controlled by 2 parameter sheets. One is general, and tells the procedures how to deal with the data returned from the various mapping providers (geoCodingParameters worksheet) and the other is specific to particular sets of data or desired results (in this case ‘step by step parameters’)
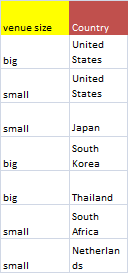
- Go to the step by Step MasterTab. This is where you enter the data to be placed on a map . You’ll find some example data that looks like this. The columns in Yellow were already completed in How to Geocode addresses using Google Maps, the latitude and longtitude would already have been calculated, and the orange columns were already completed in How to put markers on maps. Now you need to provide data in the green column. Here you will be providing your choice of categories against each record. You can use whatever categories you want here, and however many you want. You can also use multiple categories.
You will also see that the geoCoding Parameter Sheet needs to know the name of these columns if you are going to use filtering. You can change the column name to a list of columns that you want to filter on.
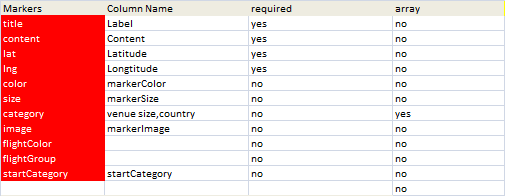
You will also see that the geoCoding Parameter Sheet needs to know the name of these columns if you are going to use filtering. You can change the column name to a list of columns that you want to filter on.

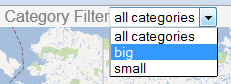
Selecting a category will hide all the markers apart from those belonging to the filters selected. The filters are additive.
If you dont want or need this, you can modify the body code in the geoCoding parameters sheet to remove the <DIV> – combocategory
<body onload="initialize()"> <div id="comboquicklink" class = "mcquicklink">Quick Links</div> <div id="combocategory" class = "mccategory"></div> <div id="heading" class ="mcheading">Excel and Google Mapping Integration</b> <a href="http://rambings.mcpher.com"> ramblings.mcpher.com</a></div> <div id="map_canvas" style="width: 100%; height: 90%"></div> </body>
QuickLink
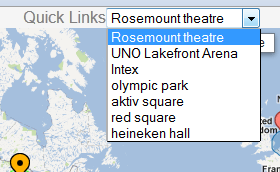
The quicklink combox box contains a shortcut to each marker. Selecting a marker will navigate to that marker and bring up its infowindow
If you dont want or need this, you can modify the body code in the geoCoding parameters sheet to remove the <DIV> – comboquicklink
Starting on a particular category
If you want to start with a particular category selected, you can add a column to your data that looks like this. The first category name it comes across in this column will be the one on which it opens the map/ Note that if this applies to only the first of your category filters (you may have multiple).

Bounding Box
A bounding box attempts to set an appropriate zoom level for the data being shown – here is the code.
var cj = mcpherData.cJobject; var bounds = new google.maps.LatLngBounds(); for ( var i = 0 ; i < cj.length;i++) { bounds.extend (new google.maps.LatLng(cj[i].lat, cj[i].lng)); }
if (!qparams['zoom']) qparams['zoom'] = 2; myOptions['zoom'] = parseInt(qparams['zoom']); // create the map gMap = new google.maps.Map(document.getElementById("map_canvas"), myOptions); gMap.fitBounds(bounds);
Complete Code
Here is the code, including the data, that is generated from Excel for the VenueMaster Example
<!DOCTYPE html><html><head><meta name="viewport" content="initial-scale=1.0, user-scalable=no" /><style type="text/css"> html { height: 100% } body { height: 100%; margin: 0; padding: 0 ; color: Gray ; background-color: WhiteSmoke; } #map_canvas { height: 100%}
.mcquicklink { margin-left: 20px; margin-right: 20px; display: inline; font-family: sans-serif; float: right;}.mccategory { margin-left: 20px; margin-right: 20px; display: inline; font-family: sans-serif; float: right;}.mcheading { display: inline; font-family: sans-serif;
}</style><script type="text/javascript" src="http://maps.googleapis.com/maps/api/js?sensor=false"></script><script type="text/javascript">
function mcpherDataPopulate() {var mcpherData = { "cJobject":[ { "title":"Rosemount theatre", "content":"<b>Rosemount theatre</b><br>Rosemont<br> IL<br> USA<br>", "lat":"41.9891", "lng":"-87.871474", "color":"#20FF00", "size":"500000", "category":"big", "image":"http://maps.google.com/mapfiles/marker_orange.png" }, { "title":"UNO Lakefront Arena", "content":"<b>UNO Lakefront Arena</b><br>6801 Franklin Ave<br> New Orleans<br> LA 70122<br> USA<br>", "lat":"30.029015", "lng":"-90.0522531", "color":"#0000FF", "size":"200000", "category":"small", "image":"" }, { "title":"Intex", "content":"<b>Intex</b><br>Nankokita<br> Suminoe Ward<br> Osaka<br> Osaka Prefecture 559-0034<br> Japan<br>", "lat":"34.6381228", "lng":"135.4253848", "color":"#00609F", "size":"300000", "category":"small", "image":"" }, { "title":"olympic park", "content":"<b>olympic park</b><br>Olympic Park<br> 88 Bangi-dong<br> Songpa-gu<br> Seoul<br> South Korea<br>", "lat":"37.5198209", "lng":"127.1227901", "color":"#80FF00", "size":"600000", "category":"big", "image":"" }, { "title":"aktiv square", "content":"<b>aktiv square</b><br>Ban Mai<br> Bang Yai<br> Nonthaburi 11140<br> Thailand<br>", "lat":"13.8448335", "lng":"100.3610179", "color":"#FF0000", "size":"1000000", "category":"big", "image":"" }, { "title":"red square", "content":"<b>red square</b><br>Red Square<br> Moscow<br> Russia<br>", "lat":"55.7546345", "lng":"37.6214955", "color":"#0000FF", "size":"200000", "category":"small", "image":"" }, { "title":"heineken hall", "content":"<b>heineken hall</b><br>Bullewijk<br> Arena Boulevard 590<br> 1101 Zuidoost<br> The Netherlands<br>", "lat":"52.3123574", "lng":"4.9441509", "color":"#00609F", "size":"300000", "category":"small", "image":"" } ] };return mcpherData; }
function initialize() { mcpherData= mcpherDataPopulate(); if (mcpherData.cJobject.length > 0) { var myOptions = { center: new google.maps.LatLng(mcpherData.cJobject[0].lat, mcpherData.cJobject[0].lng), mapTypeId: google.maps.MapTypeId.ROADMAP };
// get parameters if any var qparams = mcpherGetqparams();
var cj = mcpherData.cJobject; var bounds = new google.maps.LatLngBounds(); for ( var i = 0 ; i < cj.length;i++) { bounds.extend (new google.maps.LatLng(cj[i].lat, cj[i].lng)); }
if (!qparams['zoom']) qparams['zoom'] = 2; myOptions['zoom'] = parseInt(qparams['zoom']); // create the map gMap = new google.maps.Map(document.getElementById("map_canvas"), myOptions); gMap.fitBounds(bounds);
// add the excel data
for ( var i = 0 ; i < cj.length;i++) { mcpherAddMarker ( cj[i]); }
// Set up combox quickLink(); category(); } }
function mcpherAddMarker(cj) { var p = new google.maps.LatLng(cj.lat,cj.lng);
if (cj.size) { var circle = { strokeColor: cj.color, strokeOpacity: 0.8, strokeWeight: 1, fillColor: cj.color, fillOpacity: 0.20, map: gMap, center: p, radius: parseFloat(cj.size), }; var drawCirle = new google.maps.Circle(circle); }
var marker = new google.maps.Marker({ position: p, map: gMap, title: cj.title }); cj.marker = marker; infowindow=null; if(cj.image)marker.setIcon(cj.image); if (cj.content){ infowindow = new google.maps.InfoWindow({ content: cj.content }); google.maps.event.addListener(marker, 'click', function() { infowindow.open(gMap,marker); }); } cj.infowindow =infowindow; return marker;}
function mcpherGetqparams(){ var qparams = new Array(); var htmlquery = window.location.search.substring(1); var htmlparams = htmlquery.split('&'); for ( var i=0; i < htmlparams.length;i++) { var k = htmlparams[i].indexOf('='); if (k > 0) qparams[ htmlparams[i].substring(0,k) ] = decodeURI(htmlparams [i].substring(k+1)); return qparams; } }
function dealWithQuickLink(selValue) { var cj = mcpherData.cJobject[selValue]; if (cj.infowindow) { cj.infowindow.open(gMap,cj.marker); } return cj.infowindow; } function dealWithCategories(selValue) { var cats = createCategories(); var cj = mcpherData.cJobject; for (i=0; i < cj.length;i++ ) { cj[i].marker.setVisible (selValue ==0 || cats[selValue]== cj[i].category); } return cats[selValue]; } function quickLink() { var comboElem = document.getElementById('comboquicklink'); if (comboElem) { var selElem = document.createElement('select'); var cj = mcpherData.cJobject; mcpherAddEvent (selElem,"change",function(){ dealWithQuickLink(selElem.value); },false ,true) ; for ( var i=0; i < cj.length;i++){ var o = document.createElement('option'); o.text = cj[i].title; o.value = i; try { selElem.add(o,null); } catch(error) { selElem.add(o); } } comboElem.appendChild(selElem); }}function createCategories() { var cats =[]; cats.push('all categories'); var cj = mcpherData.cJobject; for ( var i=0; i < cj.length;i++){ if (cats.indexOf(cj[i].category) == -1 ) cats.push(cj[i].category); } return cats;}function category() { var comboElem = document.getElementById('combocategory'); if (comboElem) { var selElem = document.createElement('select'); var cats = createCategories(); mcpherAddEvent (selElem,"change",function(){ dealWithCategories(selElem.value); },false ,true) ; for ( var i=0; i < cats.length;i++){ var o = document.createElement('option'); o.text = cats[i]; o.value = i; try { selElem.add(o,null); } catch(error) { selElem.add(o); } } comboElem.appendChild(selElem); }} function mcpherAddEvent (o,e,f,b,complain){ // because IE is different if(o.addEventListener) return(o.addEventListener(e, f, b));
else if (o.attachEvent) return(o.attachEvent('on' + e, f)); else if (complain) alert ('browser doesnt support events');
return(null);
}var mcpherData;var gMap;</script></head>
<body onload="initialize()"> <div id="comboquicklink" class = "mcquicklink">Quick Links</div> <div id="combocategory" class = "mccategory">Category Filter</div> <div id="heading" class ="mcheading">Excel and Google Mapping Integration</b> <a href="http://rambings.mcpher.com"> ramblings.mcpher.com</a></div> <div id="map_canvas" style="width: 100%; height: 90%"></div> </body>
Continue discovering more Step by Step guides.
In the meantime why not join our forum, follow the blog or follow me on twitter to ensure you get updates when they are available.
- How to add flightPaths on a Map
- How to add quickLinks to a Map
- How to control your vizMap application
- How to define your vizMap application – Dictionary
- How to define your vizMap Application – visualizations
- How to Geocode addresses using Google Maps
- How to modify geocoding and mapping parameters
- How to Overlay circles on a Map
- How to prepare for your vizMap application – Data
- How to prepare for your VizMap application – Parameters
- How to put markers on maps
- How to use alternate Map icons