We previously looked at how to embed a motion chart in excel, as well as how to serialize data as input to one. As a matter of fact, the interaction with the visualization API and the format of the input data is rather standard across different kinds of charts, so it is very simple to build on what we’ve previously done to create a general purpose tool that can create any visualization chart. Adding new charts to the repertoire will therefore be very simple using this framework. You can find the generalized tool in the downloads section. This means that the previous single use implementations have now been replaced with this single tool.
Recap
We now know how to create a Google Motion Chart , Embed it in our Excel Sheet, or serialize data for input to a web page or gadget containing a motion chart. All this is achieved by a single click in our example Excel Form. To take it to the next level, we want to create a framework to make it easy to add new visualizations. The example so far includes at least Motion Charts and Intensity Maps. By the time you download it, there may have been more added.
Example Application
The downloadable example provides a form to create all the necessary web pages and data, and optionally to display the chart. It looks like this.
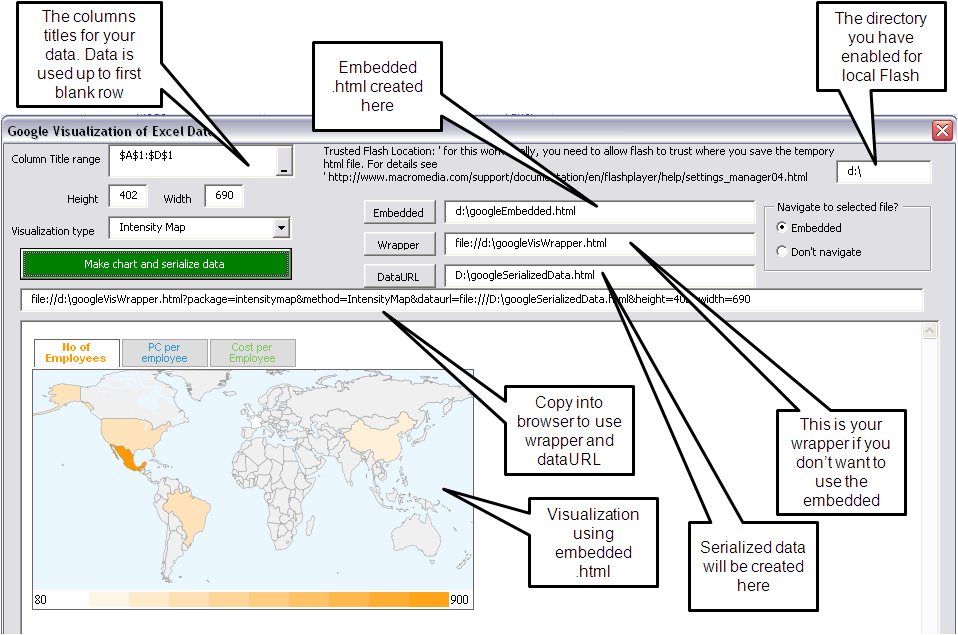
- Identifies and processes the columns of data on your active sheet that are to be used as input to Google Visualization.
- Generates an html file containing the code and data combined. This can be directly loaded in a browser locally (assuming you have followed the instructions on enabling Flash locally), or it could be loaded on a web site and executed from there.
- Navigates to that local file and shows the chart embedded in the form.
- Creates a serialized data file that you can use as input to a Google visualization Gadget or some other script that requires JSON serialized data using Google Wire Protocol. An example wrapper script is provided so you can customize it.
- Provides a command line with the parameters needed to your wrapper script in order to generate the required chart and link it to the serialized data. This would look something like this
file://d:\googleVisWrapper.html?package=intensitymap&method= IntensityMap&dataurl= file:///D:\googleSerializedData.html&height=402&width=690
Structure of the example application
- A form as above to select options and parameters
- An application module to execute the options and parameters – googleChartModule.
- cGoogleChartInput class. This class does all the work to serialize the Excel data as well as to generate the required javascript.
- cDataSet and related classes. This is a set of utility classes that abstract data from their spreadsheet location, and are used by the cGoogleChartInput class. They are not the subject of this article, but more information can be found here if required.
cGoogleChartInput class
Public Enum eGoogVis
    eGoogVisUnknown
    eGoogVisIntensityMap
    eGoogVisMotion
End Enum
It is initialized with these parameters. The headOrderArray argument is provided so that the data from the sheet can be re-organized into a different order in case it does not meet the needs of the various Google visualizations. I have not implemented this in the example application, but columns can be omitted or reorganized by specifying and array of column headings that should be included, for example array(“Country”, “Cost per Employee”) would use only 2 of the columns in that order. If the argument is missing, all columns identified by the column heading range are used. Note also that there is no validation that the input data is of the correct type for the selected visualization. You will need to read up on them to see the type of data expected.
Public Function init(htmlfn As String, rWhere As Range, _
                            Optional headOrderArray As Variant = Empty, _
                            Optional gwidth As Long = cWidth, _
                            Optional gheight = cHeight, _
                            Optional serializeddatafn As String = "", _
                            Optional wrapperfn As String = "", _
                            Optional vType As eGoogVis = eGoogVisMotion) As Boolean
Aside from minor changes in the methods that construct the javascript syntax, there was really not much more new in this class from the previous excercise. Only the google.visualization method name and the package name varies from chart to chart, so this is easily abstracted as follows
Public Property Get gvMethod() As String
    ' this can handle multiple types of visualizations.. this will be expanded as more are added
    Select Case pGoogVis
        Case eGoogVisIntensityMap
            gvMethod = "IntensityMap"
        Case eGoogVisMotion
            gvMethod = "MotionChart"
        Case Else
            MsgBox ("Programming error - chart type not implemented")

    End Select

End Property
Public Property Get gvPackage() As String
    ' these are the same as the method, but just in lcase
    gvPackage = LCase(gvMethod)

End Property
along with some parameterizations to create the javascript
Private Function ScriptStart() As String
    ScriptStart = _
        "google.load('visualization', '1', {packages: ['" & gvPackage & "']});" & vbCrLf & _
        "function " & funName & "() {" & vbCrLf & _
        "var " & datName & " = new google.visualization.DataTable();"

End Function
Private Function ScriptFinish() As String
    ScriptFinish = _
        "var " & varName & " = new google.visualization." & gvMethod & "(document.getElementById('" & divName & "'));" & vbCrLf & _
        varName & ".draw(" & datName & ", {width: " & CStr(pWidth) & ", height:" & CStr(pHeight) & "}); }" & vbCrLf & _
        "google.setOnLoadCallback(" & funName & ");"
End Function
In order to minimize name conflicts should the output of multiple charts be combined, function, data, div ID, and variable names are changed according to the type of chart we are creating
Private Function divName() As String
    divName = cDivPrefix & gvMethod
End Function
Private Function funName() As String
    funName = cFunPrefix & gvMethod
End Function
Private Function varName() As String
    varName = cVarPrefix & gvMethod
End Function
Private Function datName() As String
    datName = cDatPrefix & gvMethod
End Function
Example output
<html>
<head>
<script type="text/javascript" src="https://www.google.com/jsapi"></script>
<script type="text/javascript">

google.load('visualization', '1', {packages: ['intensitymap']});
function funIntensityMap() {
var datIntensityMap = new google.visualization.DataTable();
datIntensityMap.addColumn('string', 'Country');
datIntensityMap.addColumn('number', 'No of Employees');
datIntensityMap.addColumn('number', 'PC per employee');
datIntensityMap.addColumn('number', 'Network cost per employee');
datIntensityMap.addRows(6);
datIntensityMap.setValue(0, 0, 'GB');
datIntensityMap.setValue(0, 1, 100);
datIntensityMap.setValue(0, 2, 1.3);
datIntensityMap.setValue(0, 3, 300);
datIntensityMap.setValue(1, 0, 'US');
datIntensityMap.setValue(1, 1, 300);
datIntensityMap.setValue(1, 2, 1.7);
datIntensityMap.setValue(1, 3, 200);
datIntensityMap.setValue(2, 0, 'CN');
datIntensityMap.setValue(2, 1, 200);
datIntensityMap.setValue(2, 2, 0.8);
datIntensityMap.setValue(2, 3, 400);
datIntensityMap.setValue(3, 0, 'FR');
datIntensityMap.setValue(3, 1, 80);
datIntensityMap.setValue(3, 2, 2.1);
datIntensityMap.setValue(3, 3, 450);
datIntensityMap.setValue(4, 0, 'BR');
datIntensityMap.setValue(4, 1, 300);
datIntensityMap.setValue(4, 2, 0.7);
datIntensityMap.setValue(4, 3, 100);
datIntensityMap.setValue(5, 0, 'MX');
datIntensityMap.setValue(5, 1, 900);
datIntensityMap.setValue(5, 2, 0.5);
datIntensityMap.setValue(5, 3, 120);
var varIntensityMap = new google.visualization.IntensityMap(document.getElementById('divIntensityMap'));
varIntensityMap.draw(datIntensityMap, {width: 718, height:566}); }
google.setOnLoadCallback(funIntensityMap);</script></head>
<body>
<div id="divIntensityMap" style="width: 718px; height: 566px;"></div>
</body>
</html>
Wrapper
file://d:\googleVisWrapper.html?package=intensitymap&method= IntensityMap&dataurl= file:///D:\googleSerializedData.html&height=402&width=690
<html>
<head>

     <script type="text/javascript" src="https://www.google.com/jsapi"></script>
     <script type="text/javascript">
 //skeleton wrapper script provided by www.mcpher.com for use with serialized data generated by googlecharts.xlsm
 //free to use for non-commercial use
 //excel@mcpher.com for comments, suggestions, improvements


 //-expecting the method, package and the dataurl to be an argument with motionchart default
 var qparams = new Array();
 var jchartoptions = {};

 // default parameters
 qparams['method'] = "MotionChart"
 qparams['dataurl'] = 'file:///D:/googlechart/googSerializedData.html';
 qparams['package'] = qparams['method'].toLowerCase();
 qparams['width'] = 400;
 qparams['height']= 300;
 qparams['title']= "";

 // get parameters if any
 function getqparams(){
 var htmlquery = window.location.search.substring(1);
 var htmlparams = htmlquery.split('&');
 for ( var i=0; i < htmlparams.length;i++) {
 var k = htmlparams[i].indexOf('=');
 if (k > 0) qparams[ htmlparams[i].substring(0,k) ] = htmlparams [i].substring(k+1);

 }
 }
 getqparams();
 jchartoptions ['width'] = decodeURI(qparams['width']);
 jchartoptions ['height'] = decodeURI(qparams['height']);
 jchartoptions ['title'] = decodeURI(qparams['title']);

 // implement google visualization
 google.load('visualization', '1', {packages: [qparams['package']]});
 google.setOnLoadCallback(jmakequery);

       function jmakequery() {
         var query = new google.visualization.Query(qparams['dataurl']);
         query.send(jmotiondraw);
       }

       function jmotiondraw(response) {
         if (response.isError()) { alert('Did not get valid JSON data input')
       }

        var jdata = response.getDataTable();
 var jchart = new google.visualization[qparams['method']](document.getElementById('jchart_div'));
 jchart.draw(jdata, jchartoptions);

 //remember to put a jchart_div where you want the chart in the body of the html

 }
    </script>

  </head>

  <body>
For help and more information join our forum, follow the blog, follow me on Twitter