javaScript: creating google visualization charts and tables
This relates to Data Driven Mapping applications and the Javascript HowTo section
Google Visualization tables and charts
// and a summary chart
      if (this.infoElements['chart']){
           if (this.cTable) {
             this.chart = new google.visualization.ImageBarChart
                       (this.infoElements['chart']);
             this.chart.draw(this.cTable,
                {title:mm.parent.tabs[this.tabIndex],isStacked:false});
          }
      }
and a table
// and a google viz table of qualifying matching transactions
      if (this.infoElements['table']){
        if (this.vTable = this.createTable() ) {
           this.table = new google.visualization.Table(this.infoElements['table']);
           this.table.draw(this.vTable , mm.parent.cssTableOptions);
           // allow selection on this table
           var vizTab = this.table;
           var datTab = this.vTable;
           google.visualization.events.addListener(
                    vizTab, 'select', function() {
             conTab.dealWithSelection (vizTab,datTab);
         });
        }
      }
The output of all this is below – items 6 and 8 are being visualized Using Google Visualization DataViews as the source data.
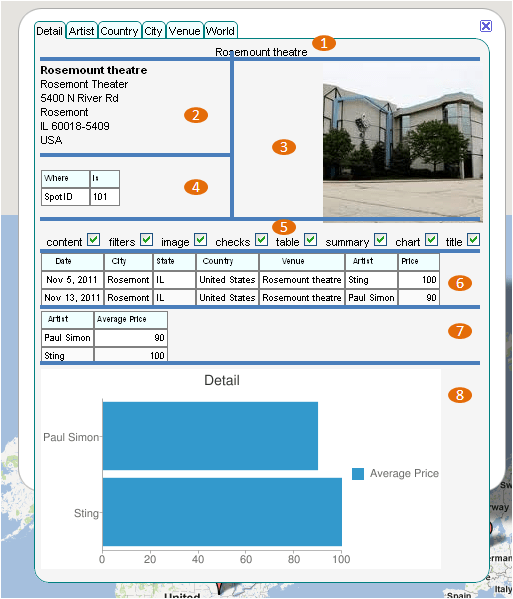
Notice also that we are looking for events on the table – this is because this application will change to another map marker if the data row selected is a different SpotID than the currently shown marker. getSelection() returns the curremtly selected row, and we can use getTableRowIndex() to find the original row of the source dataTable – (which won’t correspond to the row number in the dataView since it is filtered). From this we can figure out whether the record selected belongs to the same spot as the infowindow we are currently showing.
mcpherInfoTab.prototype.dealWithSelection = function (vizTab,datTab) {

 var row = vizTab.getSelection()[0].row;
 var newIndex = datTab.getTableRowIndex(row);
 // now we have the original item -
 //we may need oc lose this infowindow and go somewhere else
 var im = this.parent;
 var vm = im.parent;
 var spot = im.spot;
 var markerIndex = this.parent.markerIndex;
 if (newIndex != markerIndex){
  // so we may need to close this one
  var newSpot =vm.items[newIndex].spot;
  if (newSpot.spotIndex != spot.spotIndex ){
   vm.statusUpdate('change spot from '+
           spot.title + ' to '+ newSpot.title,true,null);
  }
  spot.infoWindow.close();
  newSpot.usingIndex = newIndex;
  newSpot.createInfoWindow(0);

 }
};
Tailoring table styles
.mctable {
 font-family: sans-serif;
 font-size: 0.7em;
 border: 1px solid Gray;
}

.mctableheader {
 font-family: sans-serif;
 font-size: 0.6em;
 background-color: Azure;
 border: 1px solid Gray;
}
Google Visualization table options
this.cssTableOptions =  {
     alternatingRowStyle: true,
     showRowNumber: false,
     allowHtml: true,
     cssClassNames: {
     headerCell: 'mctableheader',
     tableCell:  'mctable'
        }
    };
are used like this:
this.table.draw(this.vTable , mm.parent.cssTableOptions);
Organzation charts
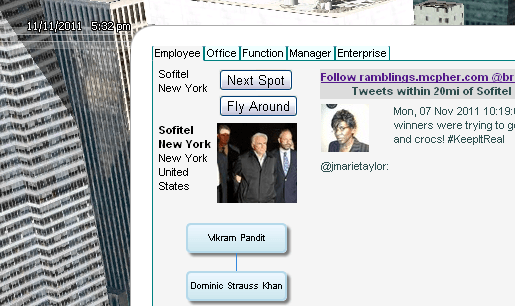
These are Google Vizualization Org Charts and the data rules are as per the API and are generated like this. Since I allow selection on this type of chart (meaning that you can select someone and it will jump to their home spot and data), I cannot use the same aggregrated table View visualization as is used for the imagebar chart. Aside from that I can use exactly the same event handler as is used for selecting from a normal table.
if (ie['chart']){
   if (this.cTable) {
    var chtType =  vm.cTabs[ vm.tabs[conTab.tabIndex] ]['charttype'];
    switch (chtType) {

    case 'barchart':
     this.chart = new google.visualization.ImageBarChart(ie['chart']);
     this.chart.draw(this.cTable,
       {title:vm.tabs[this.tabIndex],
      isStacked:false});
     break;

    case 'orgchart':
     this.oTable = this.orgTable();
     this.chart = new google.visualization.OrgChart(ie['chart']);
     this.chart.draw(this.oTable,
       {title:vm.tabs[this.tabIndex]});
     // allow selection on this chart
     var vizTab = this.chart;
     var datTab = this.oTable;
     google.visualization.events.addListener(vizTab,
       'select', function() {
      conTab.dealWithSelection (vizTab,datTab);
     });

     break;

    case 'none':
     break;

    default:
     alert('unknown charttype ' + chtType);
    break;
    }
   }
  }
Even handler
mcpherInfoTab.prototype.dealWithSelection = function (vizTab,datTab) {

  var row = vizTab.getSelection()[0].row;
  var newIndex = datTab.getTableRowIndex(row);

  // now we have the original item -  we may need oc lose this infowindow and go somewhere else
  var im = this.parent;
  var vm = im.parent;
  var spot = im.spot;
  var markerIndex = im.markerIndex;

  if (newIndex != markerIndex){

   switch (vm.provider){
   case 'maps':
    spot.infoWindow.close();
    break;
   case 'earth':
    break;
   default:
    alert('dealwithinsanity');
   }
   // so we may need to close this one
   var newSpot =vm.items[newIndex].spot;
   vm.gotoAnotherSpot (spot, newSpot);
   newSpot.usingIndex = newIndex;
   newSpot.createInfoWindow(0);
  }
 };
As usual questions, feedback and comments are welcome at our forum. Now lets take a look at more javaScript snippets from this application