Deprecated
Google has now stopped its Earth API and Maps API is a paid for API nowadays. Some capabilities have also been either removed or changed. Therefore, I had to remove all examples of VizMap applications I had created. I didn’t remove the entire topic as I thought some of the code may still be useful with some modifications. 

VizMap: the tabs parameter Block 

This relates to Data Driven Mapping applications

This parameter block is handled by cDataSet classes and defines the dictionary fields required for using as replacements for the standard placemark icon.

For this example I had created a  Concerts/Venues example that is now deprecated. The complete workbook (googlemapping.xlsm) can be downloaded (above) and the example Parameter WorkSheet is called VenuesParameters.

Before setting up the Tabs Parameter Block, you should first define the VizMap Dictionary and the VizMap Tabs parameters

Tabs Parameter Block

The block for the example application we are using can be found in the VenuesParameters WorkSheet,  looks like this and is terminated by a blank line. Note that Twitter Fields are mentioned here. I am going to deal with that in another section, so this example will have twitter disabled for this discussion.
Each row will generate a new tab in the info window, and the fields will be used in the order they appear. The generated infoWindow from this tab Parameter block looks like this.

Elements and Fields

Each  infoWindow tab is divided into elements, each of which takes its content from data fields specified here. The elements can be repositioned, which will be covered in a future section but here is how the fields mentioned in the tabs parameter block map to what is shown under its tab.
Notes
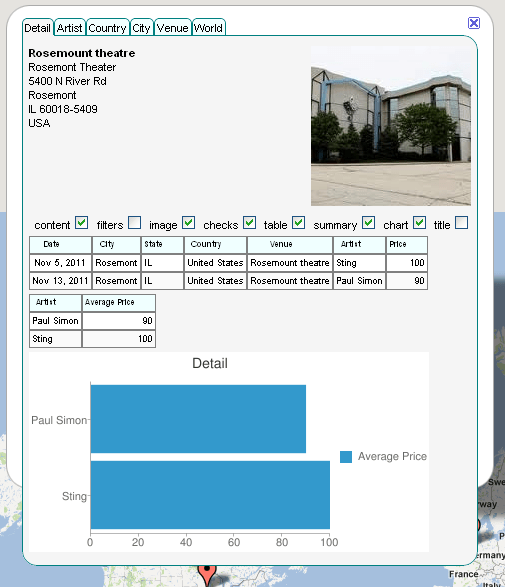
  1. The FILTER FIELDS are used to define which records appear on a given tab. On the one shown above (the detail tab), any item with a matching SpotID will be included. So in the case of this tab, where we are trying to show the detail around this particular map marker, any concert at this venue will be included.
  2. Each of the series of CHECK boxes represent whether an ELEMENT should be shown in this tab. You can turn them on and off dynamically and set their initial value in the Elements positioning section
  3. The CHART FIELDS control what is shown on both the SUMMARY and CHART element. All these items are google Visualizations so need to follow the associated data type rules. An image barchart needs its first data item to be of type string and subsequent items to be number.
  4. The IMAGE should be a URL pointing to a picture to show when this item is selected
  5. The CONTENT and TITLE come from the mandatory dictionary items of the same name.
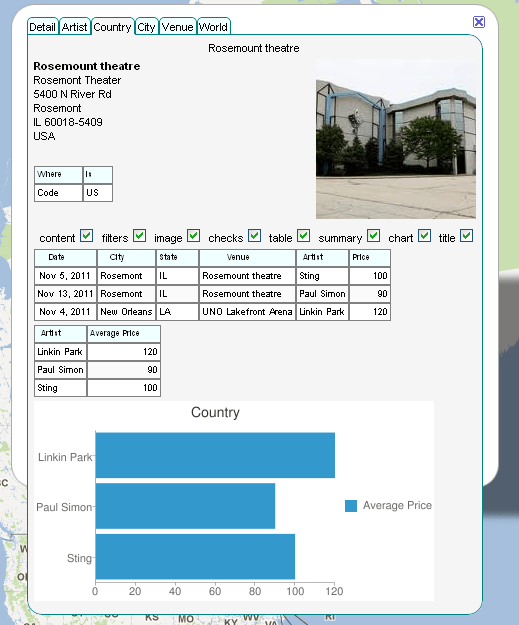
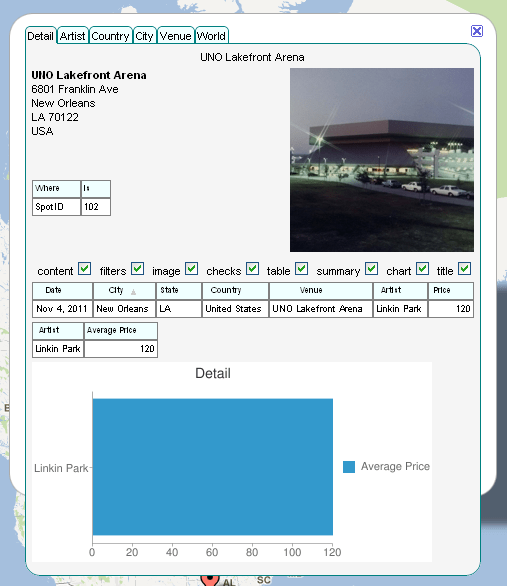
Another TAB view

Here is the country Tab to illustrate a different view of the same location.  Since the filter is Code, it will show all items in the same country as the currently selected SpotID.
However, the items in the table element are selectable, so if I select the New Orleans Venue, this will close and it will take me to a marker over the New Orleans venue as below.
When I select the ‘Artist’ tab – I can get to see everywhere that Linkin Park are playing, and if I further select one of those lines it will take me to that venue, etc – so this gives a pretty powerful visualized data mining capability.

jSon representation

The jSon representation of this is generated automatically as part of the VizMap application generation, and is part of the framework section. The above generates the following jSon fragment.
"tabs":{
         "Detail":{
            "filter":[
               "SpotID"               
             ],
            "chart":[
               "Artist",
               "Average Price"               
             ],
            "table":[
               "Date",
               "City",
               "State",
               "Country",
               "Venue",
               "Artist",
               "Price"               
             ],
            "twitter":[
               "Artist"               
             ],
            "image":"Venue Photo",
            "charttype":"barchart"
         },
         "Artist":{
            "filter":[
               "Artist"               
             ],
            "chart":[
               "City",
               "Average Price"               
             ],
            "table":[
               "Date",
               "City",
               "State",
               "Country",
               "Venue",
               "Artist",
               "Price"               
             ],
            "twitter":[
               "Artist"               
             ],
            "image":"Artist Photo",
            "charttype":"barchart"
         },
         "Country":{
            "filter":[
               "Code"               
             ],
            "chart":[
               "Artist",
               "Average Price"               
             ],
            "table":[
               "Date",
               "City",
               "State",
               "Venue",
               "Artist",
               "Price"               
             ],
            "twitter":[
               "Country",
               "Artist"               
             ],
            "image":"Venue Photo",
            "charttype":"barchart"
         },
         "City":{
            "filter":[
               "Code",
               "State",
               "City"               
             ],
            "chart":[
               "Artist",
               "Average Price"               
             ],
            "table":[
               "Date",
               "Venue",
               "Artist",
               "Price"               
             ],
            "twitter":[
               "City",
               "Artist"               
             ],
            "image":"Venue Photo",
            "charttype":"barchart"
         },
         "Venue":{
            "filter":[
               "ID"               
             ],
            "chart":[
               "Artist",
               "Average Price"               
             ],
            "table":[
               "Date",
               "Artist",
               "Price"               
             ],
            "twitter":[
               "Venue"               
             ],
            "image":"Venue Photo",
            "charttype":"barchart"
         },
         "World":{
            "chart":[
               "Artist",
               "Shows",
               "Average Price"               
             ],
            "table":[
               "Date",
               "Venue",
               "Artist",
               "Price"               
             ],
            "twitter":[
               "Artist"               
             ],
            "image":"Venue Photo",
            "charttype":"barchart"
         }
      },

Questions, feedback and VizMap applications you have generated can be submitted for loading to this site via our forum.  The next step is to create the VizMap Element positioning which define what to do with these dictionary items.