The coronavirus is with us, and naturally, there’s much interest in data on its mortality, reach and spread, and of course much discussion on lockdowns, health capacity, social distancing and how they might affect those variables. I figured that a simulation where you could play with those factors might be interesting to create.
Disclaimer: I have no special knowledge in these matters, so cv-viz is provided as a visualising learning tool rather than any sort of realistic simulation of how the spread of infection might be altered.
Hosting
You can play with the simulation here. https://cv-viz.web.app/
It looks like this

Source code
I welcome collaborators who might want to improve the model. The source code is here. https://github.com/brucemcpherson/cvviz
Methodology
I’ll get into some of the code in sub-pages to this article, but first off let’s look at some of the design.
Time
The simulation runs its own clock. This allows it to speed up and speed down and pause, but also allows things like infection time, distances between nodes and so on to be expressed in ‘simtime’ rather than real-time. The clock visualizes simtime into actual time.
People
Each actor in the simulation (a person) belongs to a family and has a personality and a name. Each home belongs in an area and is assigned to a family. A person is assigned to a family, which is assigned a home in a given area. The number of areas and homes are dependent on the number of people in the simulation, and the target distribution of people per family. These areas, homes, and people are randomly positioned at the beginning of the simulation, starting off inside their own homes but occasionally randomly venturing outside, based on various parameters.
Personalities
These are constructed from distributions around various mean values and randomly and permanently assigned to people at the start of the simulation. These values represent various characteristics such probability to comply with rules, susceptibility to infection, contagiousness, vulnerability and a few other factors. Together all these are used to assess the outcome of an encounter between 2 people (a highly susceptible person interacting with a highly infectious person is more likely to produce an infection), or an outcome (a vulnerable person is less likely to recover). Other things like speed of travel are also assigned. All these measures stay with an individual throughout the life of the simulation.
Public places
In addition to homes, there are also public places like parks, supermarkets and so on which are possibly destinations for those venturing out. The bigger greenish circles here are public places, the smaller grayish circles are homes, and the yellowish circles are areas

A public place will attract more people than someone else’s home (even more so when compliance is strong – I’ll cover compliance later)
States
A person’s state defines whether a person is currently healthy, infected and so on. A state can be any one of these. Initial states are randomly assigned at the beginning of a simulation. Generally, it will start with only a few carriers (Patient 0), and a small number of immune. The numbers in the statistics are generally percentages of the total population rather than real numbers.
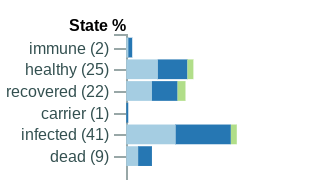
This chart also shows how many of each are at home, visiting or moving. If someone dies while not at home, they are still reported as visiting and visualized in the place they died.
Status
The status of the sim over time is shown by this chart. The colors match the color of the moving people dots.

Hotspot
During an infection, a person is more likely to pass it on during a particular phase of that infection. This varies per person, so these are initially assigned from the distribution of ‘hotspots’ to individual personalities. The infectiousness of a person is calculated by not only their innate infectiousness but also how close they are to their own personal hotspot. In other words, someone at say, day 2 of infection, is more likely to pass it on than someone at say, day 14.
Superspreaders
In line with the idea that some are more likely to infect on than others due to their own behavior and infectiousness, ‘superspreaders’ can emerge in the course of a simulation. The top 10 are reported like this, alongside the number of people they’ve infected.
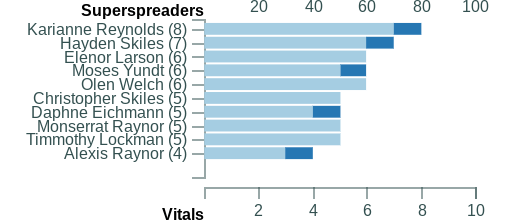
Vitals
The simulation shows the progress on some key measures

The r0 figure is the average number of other people 1 infected person then infects. It is not especially realistic as with the limited population possible in a visual simulation, we quite quickly run out of others to infect.
Capacity
This can be changed during the course of a simulation
![]()
Capacity is a metaphor for the health system’s capability to deal with the crisis. In real life, I guess it would mean equipment, staff, beds etc.
Manageability
This measure is derived from the number of active cases and capacity. It’s logarithmic on the basis that more active cases and less capacity mean that the system would be overwhelmed. In a period where manageability is lower than activate cases, there’s an increased probability that someone will die during their infection.
Compliance
This is another factor that can be dynamically changed during the simulation.
![]()
Compliance plays into a number of probabilities, and overall compliance is derived from both this adjustable measure, as well as from an individual’s personality profile. Here how some probabilities are affected by low compliance, all of which result in an increased probability of infection
- Going out increased
- If going out, visiting other homes increased
- In an encounter, social distance is less respected
- Masks another distancing measures are less common
Social distance and compliance
It’s hard to use physical distance when the minimum unit of measurement in a viz is 1 pixel, and depending on the number of people in the simulation, their radius is only a few pixels, so this is simulated by reducing the number of collisions that result in an encounter according to compliance with social distancing This idea is used as a metaphor for not only social distancing but also the likelihood of mask-wearing, hand washing etc.
How infections happen
When two people pass within a certain distance of each other, either in a home or public place or while travelling between places, a collision is declared. That leads to the possibility of an ‘encounter’. High compliance reduces that possibility, so there are less declared encounters per collision. Once an encounter is recognized between one who is healthy and another who is either infected or a carrier, whether it leads to an infection event depends on the combination of some randomness, the individuals’ susceptibility and infectiousness profiles, the phase of the infector relative to their hotspot profile and the overall static infectious measure of the virus. If an infection does occur, then the infectee’s state is changed and they immediately become capable of infecting others (the probability modified by their hotspot profile). Visually, they expand in the sim for a short period of time, change color, then eventually return to their normal size. This is useful to be able to spot infections as they happen.
How recovery and death happen
Each individual has a time till recovery and time till death assigned to their profile from distributions around the means for those factors. When that time arrives, some randomness is combined with the virus mortality rate, their own personal mortality probability and the current manageability and they either die, recover, or are reassessed in a later cycle. Just like an infection, their change of state will be visually represented by an increase in size, change in color and gradual reversion to original size.
Going out and going home
Each individual has a personality profile with the probability of the number of times they’re likely to go out during a day, along with how long they are likely to go out for. Whether they go out is calculated from combining that, their individual and overall compliance and some randomness. Once picked to go somewhere, there is another round of chance for where to go. If someone is not at home, they will most likely go home, otherwise where they go is determined by their overall compliance. If they are compliant and are picked to go out they are more likely to go to a public place (like work, shopping etc) than to visit someone else’s home. The choice of destination is then biased towards the size of the potential destination. How long it will take them to get there is based on the size of the sim world, how far away the destination is, their usual speed from their profile and some randomness. The actual visualization of a journey is slowed down for visual effect, otherwise it would just be a jumble of moving dots. When the visit ends is decided by some randomness and their usual visit length profile.
Size of population
Ideally, this would work a lot better with millions, but because of visualization limitations, CPU and memory capability, about 1000 is the maximum viable amount of people to show. The size can be tweaked but will cause the sim to restart from scratch. The default is 500 people.
![]()
The reset button restarts the sim with the same number of people as the currently running one.

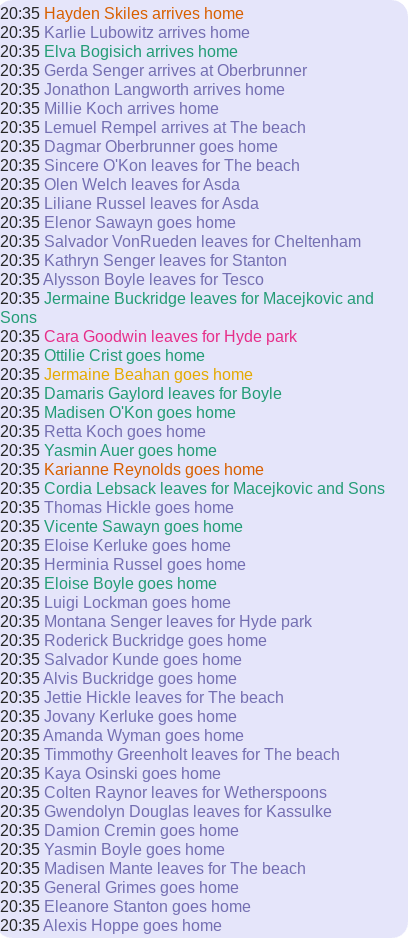
Logs
During the sim, you can follow progress on the log.
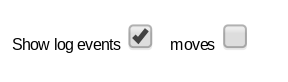
Events are limited to infecting, recovering and dying.
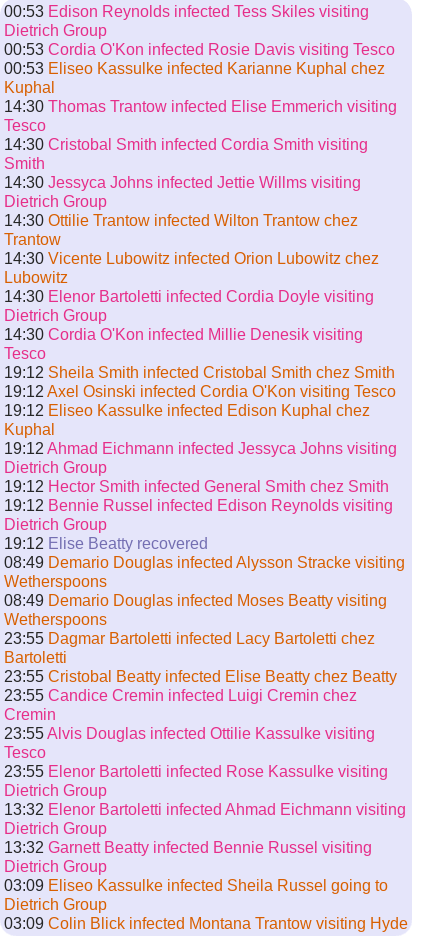
Moves include leaving for and arriving at places.
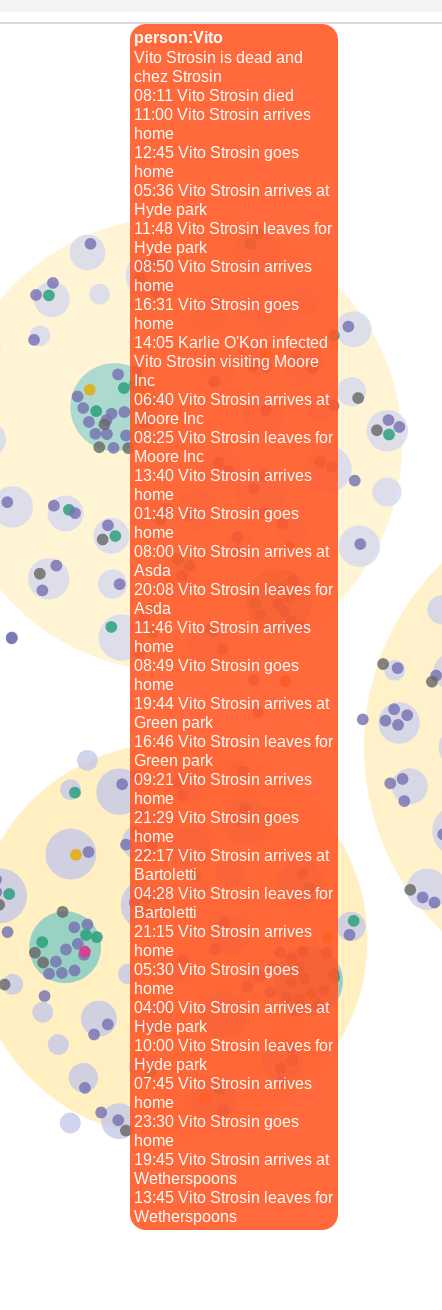
Personal logs
Individuals have a record of everything they’ve done, which can be seen by hovering over. Towards the end of the sim, these can get pretty long.
Place and area summaries
Hovering over an area
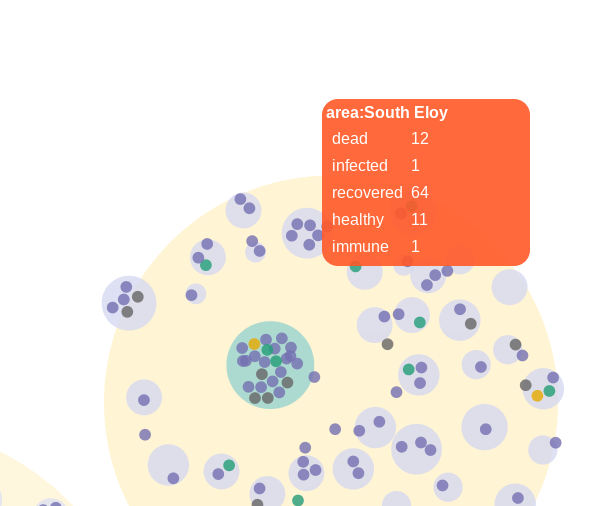
or a place
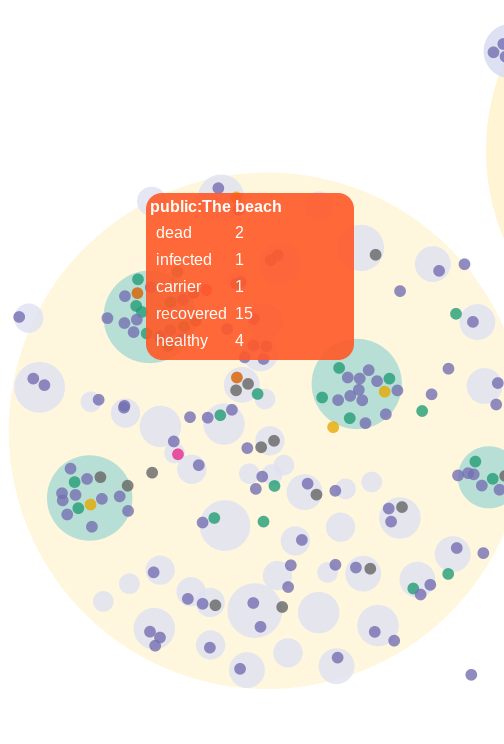
shows how many people there are currently there, and what their status is.
Is it realistic
I’m not qualified to say, but it’s interesting to watch the sim, which gives pretty consistent results across similar parameters over a period of a couple of sim months. It’s a pity that it’s a goldfish bowl with only a small population, so as would happen on say, a small island, pretty much everyone eventually gets infected. In any case, here are the results.
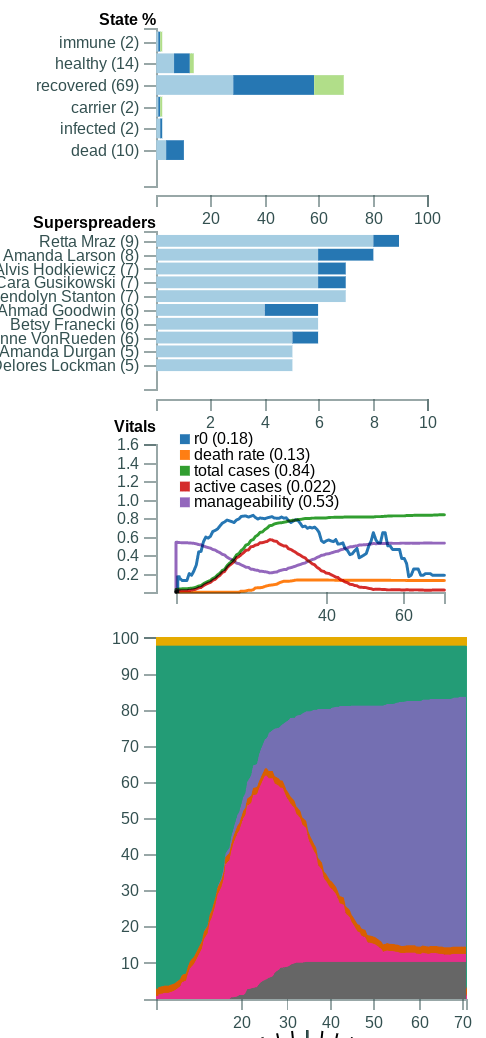
Default settings
74% of the population were infected and recovered, 10% of the population died. Peak was at 25 days.
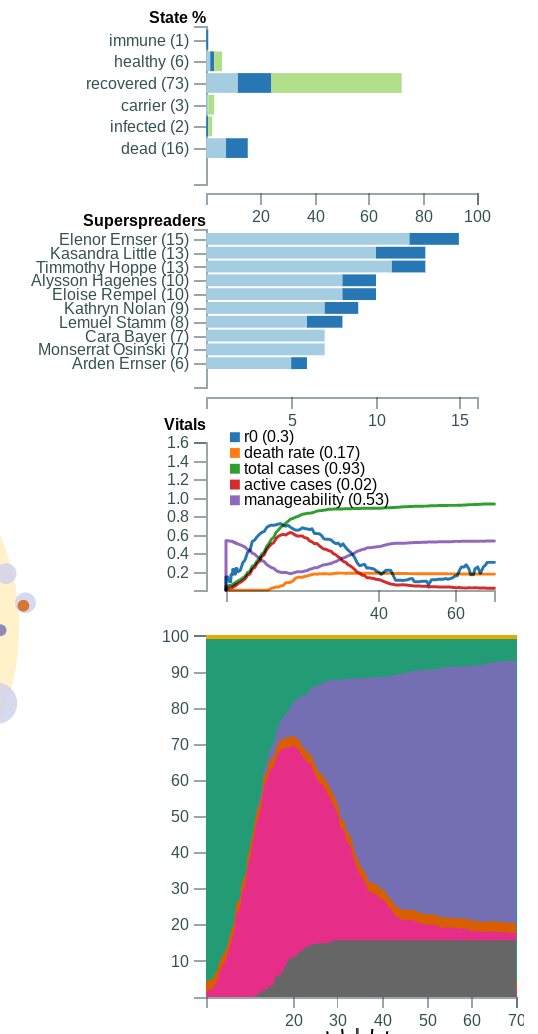
Poor compliance
Lots of going out, some big superspreaders emerge.
77% of the population were infected and recovered, 16% of the population died. Peaked at 20 days.
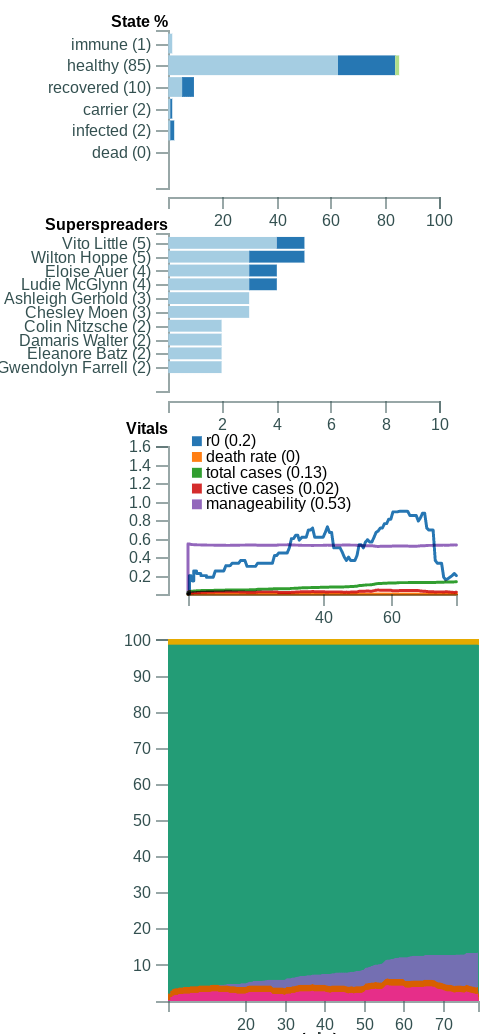
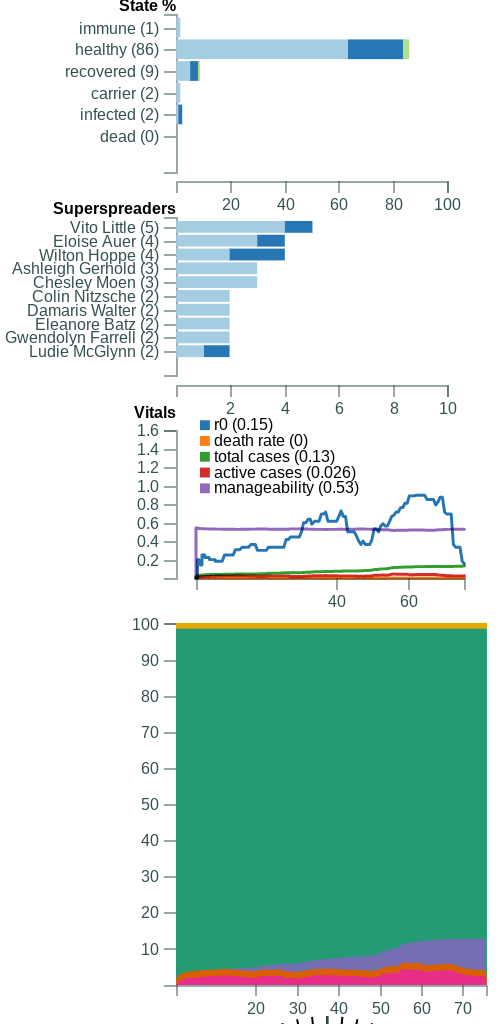
Full compliance
A boring one to watch – hardly anybody goes out, and when they do it’s to work or the shops. Manageability is always higher than in active cases.
13% of the population were infected and recovered, nobody died. There wasn’t really a peak
 |
 |
Minimal capacity
This is an interesting one. Resources are immediately overwhelmed as the active cases exceed manageability from day 1. As expected many people die, but overall fewer people are infected, presumably because many potential infectors are removed from the board by dying early.
50% of the population were infected and recovered, 29% of the population died. Peaked at about 25 days.

Could continue with these examples, but it seems to be acting as expected. Please leave comments on the Github issue tracker.
The tech
You can play with the simulation here. https://cv-viz.web.app/
Source code is here https://github.com/brucemcpherson/cvviz
The main tech is D3, and I’ll go through some of the trickier parts in future posts for those that are interested.