What is d3.js
d3.js is a javaScript library that provides a ‘declarative framework’ for DOM manipulation and simplified access to SVG. d3 is the work of Mike Bostok and you should spend some time taking a look at the material on his web site to get an idea of the great things that can be done with d3.js Note that some visualizations with d3.js do not work with IE8 and below. Chrome and Firefox are ok. I haven’t tested Safari yet.
What has d3 to do with this site
This site is primarily about Excel, but more importantly about extending Excel to integrate with all good things out there. I have already covered topics such as Get Data From Google Docs, Mapping and adding markers to maps, Data Driven Mapping applications, From VBA to Google Apps Script, Google Visualization, Excel JSON conversion, Rest to Excel library and many more. Using d3.js as a framework will open up a whole new opportunity for integrating Excel with modern web based visualizations.
Approach
As with many of the other solutions mentioned, in all cases for d3.js integration a web page containing the necessary javaScript will be generated from your Excel data and parameters. There are also a number of d3 examples which are nothing to do with Excel – consider them to be ‘post excel liberation’ examples.
Visualizations
Here is the list of visualizations available. Each solution is part of the cDataSet.xlsm download.
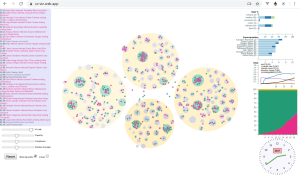
cv-viz: Virus infection simulation with D3.js

HTML service without caja
Centering text in arc textpath with D3
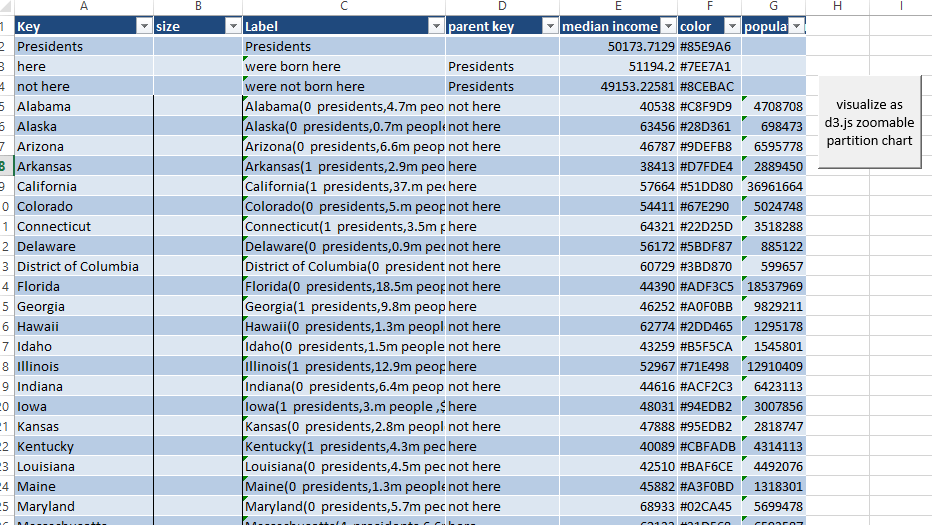
Zoomable Partition Charts

Making sense of joins in D3
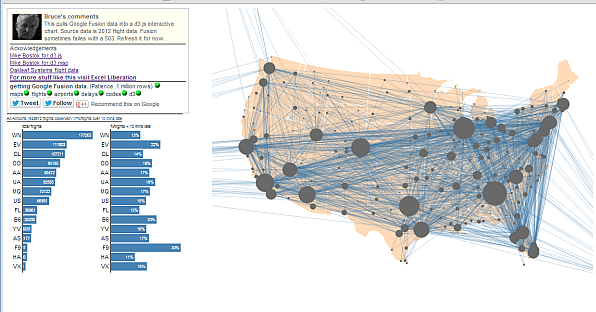
Flight data from Fusion
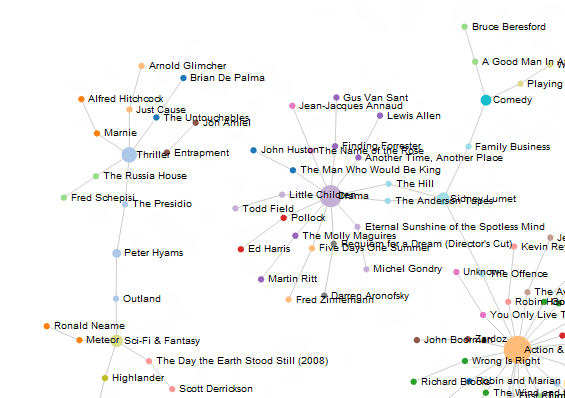
Excel tables to d3.js Force diagram
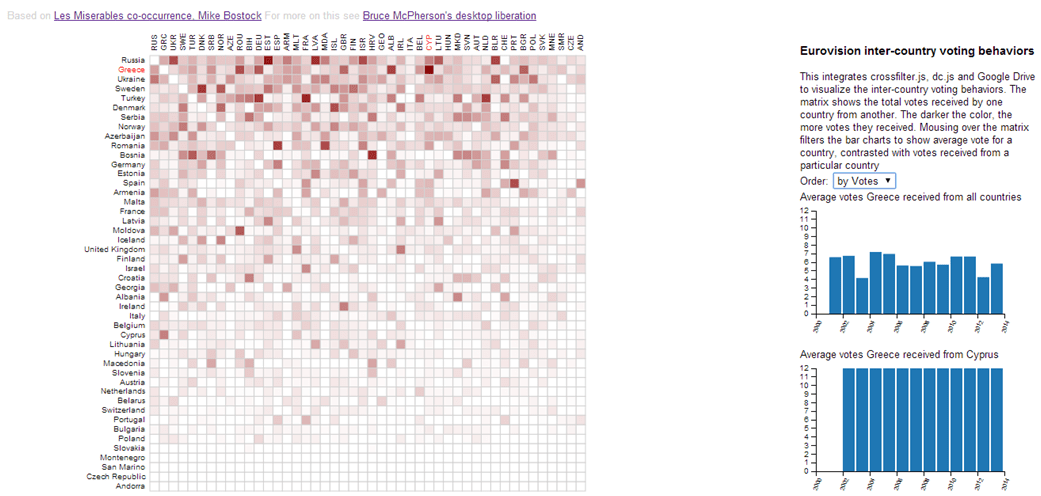
Eurovision results with crossfilter and dc.js
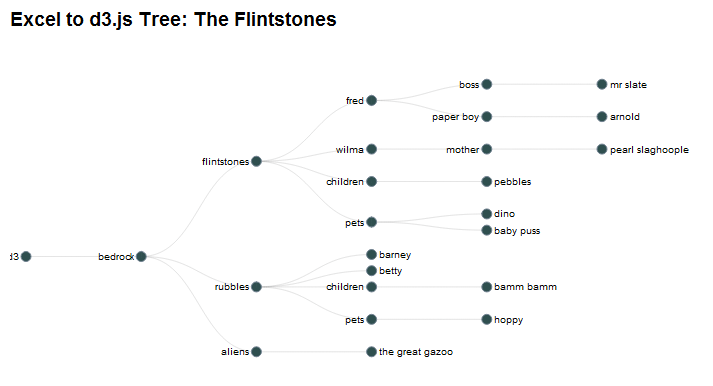
Creating d3.js Tree diagrams