Acknowledgement
Much of the JavaScript and d3.js came from Mike Bostok’s site. If you use any of this material, please be sure to maintain the acknowledgement for his work.
There have been a few features added to this since this entry. See these blog posts – adding urls to Sankey links and nodes, inheriting data cell colors for Sankey links, and another Sankey example
These are implemented in the cDataSet workbook, downloadable from here.
If you are Google Sheets user, here’s an Add-on to create these directly in Sheets.
What are Sankey diagrams?
They are designed to show flows through a network, and are sometimes called flow diagrams. In this example we will take some Excel data and directly create an interactive Sankey diagram. This supposed to represent the breakdown of effort that a fictional company spends in various functions and roles. Here is a screenshot. You can try the interactive version here (note that this doesn’t work properly with IE8 and below)
Here’s a screenshot for those with older browsers.

Data Structure
This kind of visualization can be thought of as being a column chart that also shows the connections between sections of each column. That means that each data item needs to describe
- A source and target (which column sections are connected)
- A value (which values transfer between each column section)
- Labels (what to call each column section)
Now it may be that you want to give two columns the same name (let’s say this represented some kind of transformation where the labels before and after were the same), so it means that I needed to allow for an ID (to represent the source and target) and a label in the data
format. Here is a section of the input data that created the above, which you can find in the Sankey tab of the cDataSet.xlsm download
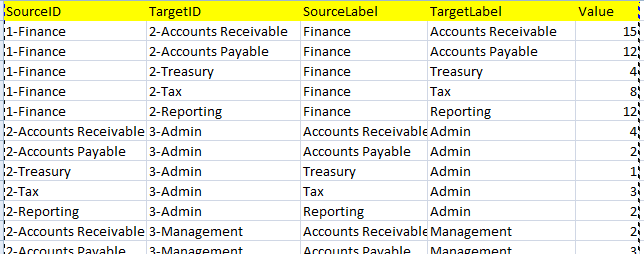
To create a Sankey diagram, you simply need to construct a table as above.
Tweaking the format
As in other projects on this site, the javaScript, css and html that does all this is stored as a series of parameter values in a parameter sheet- in this case the sankeyParameters sheet. This looks like this
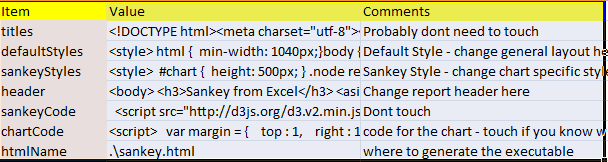
Most of this you won’t need to touch, but you can tweak the style (these are css style definitions) and header parameters to affect the layout and content of the final web page. It is also possible to change the operation of the chart if you are comfortable with d3.js – you can find this in the chartCode parameter. The generated filename is set with the htmlName parameter.
Some directories on your machine may be read only to you – for example, if you have downloaded this and run it from the download directory on windows 8 you may not be able to create a file in that directory because of local permission settings. You should set this to a directory you have permission to create files in.
This is a single file with no dependencies (except to the d3.js library) and you can put it on a web site or mail it to someone as you wish. Note that IE8 and below may not work. Chrome and Firefox are good.
The VBA Code
All code is implemented in the cDataSet.xlsm download. Here is the calling procedure to generate and execute the chart code.
Public Sub testSan()
    Dim ds As New cDataSet, cs As New cSankey, dsParam As New cDataSet, _
        js As String, content As String
    ' generate a sankey chart from excel data
    ' get parameters
    dsParam.populateData wholeSheet("sankeyparameters"), , , True, "Item", , True
    ' get data values as json
    js = cs.init(ds.populateData(wholeSheet("sankey"), , , , , , True)).jSon
    ' construct the executable file
    With dsParam
        content = .cell("titles", "value").toString
        content = content & _
            .cell("defaultStyles", "value").toString
        content = content & _
            .cell("sankeyStyles", "value").toString
        content = content & _
            .cell("header", "value").toString
        content = content & _
            .cell("sankeyCode", "value").toString
        content = content & _
            ""
        content = content & _
            .cell("chartCode", "value").toString
        With .cell("htmlname", "value")
            openNewHtml .toString, content
            If Not OpenUrl(.toString) Then
                MsgBox ("could not open " & .toString & " using default browser")
            End If
        End With
    End With
End Sub
I have introduced a new class – cSankey – which is reponsible for organizing the Excel data, and creating a suitable jSon representation as expected by the d3.js sankey plugin.
Here is the code for that class
' this is used to create sankey diagram input jSon data to D3.js plugin
Option Explicit
Private pUnique As cJobject
Private pDset As cDataSet
Private pIgnoreZero As Boolean
Public Property Get dSet() As cDataSet
    Set dSet = pDset
End Property
Public Property Get unique() As cJobject
    Set unique = pUnique
End Property
Public Property Get jSon(Optional optBeautify As Boolean = False) As String
    Dim s As String
    s = Trim(jObject.serialize(optBeautify))
    ' special tweak for json format needed- get rid of extra {}
    jSon = Mid(s, 2, Len(s) - 2)
End Property
Public Property Get jObject() As cJobject
    'return a jobject version for input to D3.js sankey diagram
    Dim cs As cJobject, dr As cDataRow, cc As cCell, _
            job As cJobject, nodes As cJobject, links As cJobject
    Set job = New cJobject
    Set job = job.init(Nothing)
    Set nodes = job.add("nodes").addArray
    For Each cs In pUnique.Children
        With nodes.add
            .add "name", cs.toString
        End With
    Next cs
    Set links = job.add("links").addArray
    For Each dr In pDset.rows
        If (dr.cell("Value").Value <> 0 Or Not pIgnoreZero) Then
            With links.add
                .add "source", getUniqueIndex(dr.cell("SourceID").toString)
                .add "target", getUniqueIndex(dr.cell("TargetID").toString)
                .add "value", dr.cell("Value").Value
            End With
        End If
    Next dr
    Set jObject = job
End Property
Private Function getUniqueIndex(s As String) As Long
    Dim job As cJobject
    Set job = pUnique.Find(makekey(s))
    If (job Is Nothing) Then
        getUniqueIndex = -1
    Else
        getUniqueIndex = job.childIndex - 1
    End If
End Function
Public Function init(ds As cDataSet, Optional optIgnore As Boolean = True) As cSankey
    Dim a As Variant, i As Long, cc As cCell, ct As Collection
    pIgnoreZero = optIgnore
    Set pUnique = New cJobject
    pUnique.init(Nothing).addArray
    Set pDset = ds
    ' populated with these fields
    If (ds.headingRow.validate(True, "SourceID", "TargetID", "SourceLabel", _
        "TargetLabel", "Value")) Then
        ' sort out the names - each source or target id needs a label
        ' these are all the source labels
        Set ct = ds.column("SourceID").uniqueValues(eSortAscending)
        For Each cc In ct
            pUnique.add makekey(cc.toString), ds.cell(cc.row, "SourceLabel").toString
        Next cc
        ' the missing ones we will use the target label
        Set ct = ds.column("TargetID").uniqueValues(eSortAscending)
        ' the unknown  ones need the ToLabel
        For Each cc In ct
            If (getUniqueIndex(cc.toString) = -1) Then
                  pUnique.add makekey(cc.toString), ds.cell(cc.row, "TargetLabel").toString
            End If
        Next cc
        Set init = Me
    End If
End Function
You can find out more about other d3.js visualizations from Excel here.