Deprecated
Google has now stopped its Earth API and Maps API is a paid for API nowadays. Some capabilities have also been either removed or changed. Therefore, I had to remove all examples of VizMap applications I had created. I didn’t remove the entire topic as I thought some of the code may still be useful with some modifications.
Creating data driven applications straight out of Excel get it now
This article will cover these main topics
- How to create rich applications which pulls together Google Maps ,Google Visualization, Twitter and Google Earth.
- How to setup parameter sheets which describe these applications, so they can be created without needing to write any javaScript
- If you want, all the behind the scenes javaScript code which can be used with or without Excel
- Use the generated web applications as standalone web pages.
Try it out first ?
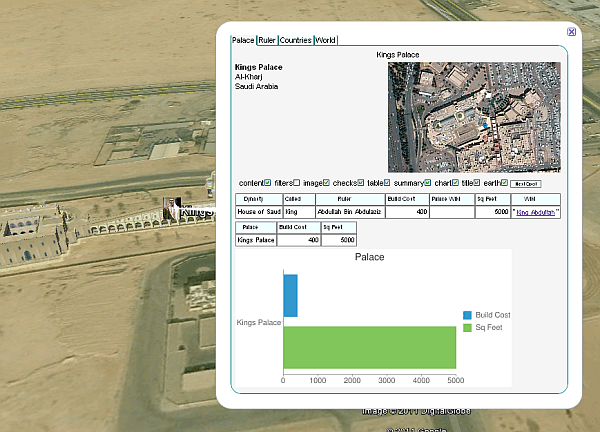
If you just want a to try it, then you can download an example application (googleMapping.xlsm) and come back here later. For a quick start see Step by Step Guides Here’s a screenshot from an Earth version that I had created
and the same thing using Google Maps
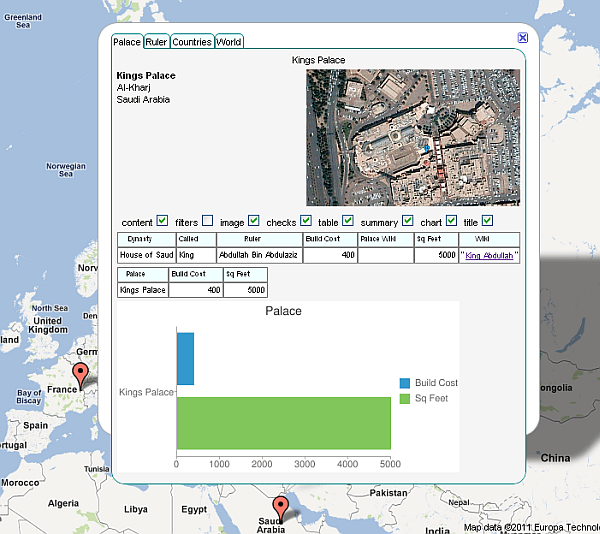
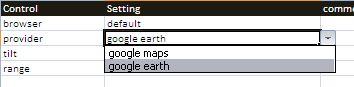
You can select either just by changing a parameter in your worksheet.
I haven’t spent much time on populating these with accurate data but hopefully you can see the general approach from these web pages. You can read the Excel Ramblings Blog entry on this topic here.
The VizMap application
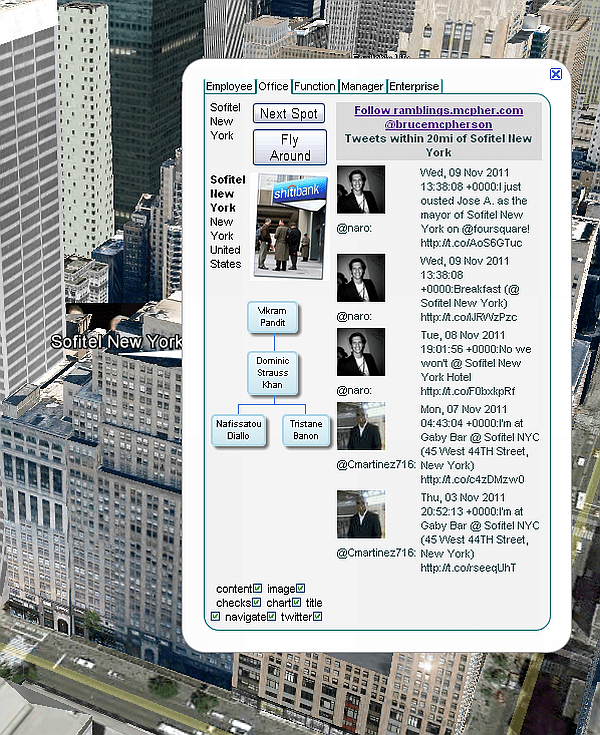
VizMap is the collection of components that allow you to create a data driven application that will merge google visualization and google mapping straight out of Excel. This consists of several components, which are all integrated in the Excel Driving application, and many of which can be seen in other roles throughout this site. Here is a popped up info window from a VizMap application that simulates an organization with multiple sites. You can see that not only is there an org chart there are also selected tweets based on the location within some radius.
- GeoCoding parameters. This describes how to deal with the response from various geoCoding providers and how to incorporate this in the VizMap application. This is the same as was introduced in the section on GeoCoding
- Application specific parameters. These describe the data to be shown on the map, which visualizations to embed in the map Popup Windows, where to position them, what data to include, and any tailoring information required to construct specific web page look and content. There will be one of these for each VizMap application, and from this a self contained web application will be generated.
- Master/Transaction joining application. When creating these kind of applications, there is often a join of transactions to master data and look up data required. The googlemapping.xlsm workbook also contains a capability to do this using Data Manipulation Classes covered elsewhere on this site.
- Excel/Json Conversion. Data and parameters are communicated from Excel to the Web applications and web services used using jSon. We use the cJobject serialization capability covered elsewhere on this site.
- Javascript modules. These are general purpose javaScript functions that make up the VizMap application. Normally you would not have to touch these, but you can tailor them if you wish. They are generated and embedded in the final application .html file by the Excel application, and the code for them is included in the geoCoding parameter sheet.
- Framework and Data functions. The framework of the application is a jSon representation of the behavior expected from the generated VizMap application, and the data is a jSon representation of the input data. These are presented to VizMap through two functions which are generated out of Excel. However one or both of these can be created manually in javaScript, or perhaps be the result of webService call to Google Docs or some other data provider. In other words, even though we can generate the entire VizMap application from Excel, you can create a dynamic web application that does not use Excel to get it’s data or even to define the VizMap application framework.
VizMap details
Here is how to setup your own VizMap application, and a deep dive into how it works.
- Creating a VizMap Application
- GeoCoding
- Joins
- Tailoring Output
- VBA – the Excel code walkthrough
- javaScript – the generated VizMap application
- Creating VizMap framework without Excel
- Providing VizMap Data without Excel
- javaScript ‘howTo’
- Creating a tabbed Google Mapping InfoWindow
- Embedding Google Analytics in your VizMap application
- Using Google Maps
- Using Google Visualization DataTables
- Using Google Visualization DataViews
- Using Google Visualization charts and tables
- Using Google Earth
- Click events in Google Earth
- Flying around with Google Earth
- Using Twitter in Earth and Maps
Moving on from the concept of data abstraction, this application abstraction is attempting to open up the world of Google Maps and Google Visualization to Excel users, many of whom do not know javaScript and would therefore not be able to participate. If you create any useful VizMap applications, or have any interesting data to show in this way, I would be happy to publish them on this site and make them available for download. As usual questions, feedback and comments are welcome at our forum.
For help and more information join our forum, follow the blog, follow me on Twitter