I’ve been playing around with the live integration of large cloud based data sets with D3.js. Most visualizations with D3 use some kind of static data, but I became interested in pulling different source into d3. For example, here is d3 integrated with parse.com which is fine for trivial data, but not much good for large data tables. Here’s how to integrate d3 with a large data set hosted on Google Fusion tables.
The data
For this example. we’ll use 2012 flight performance data. That’s every flight in the USA and its on time performance. In total it’s close to a million rows queried a few times. The question is whether that can be a viable data source for d3.js.
Google Fusion
We’ll take the data from Google Fusion. I found the majority of the original data (Oakleaf systems) on Azure, but quite frankly the Azure API was way too irritating, so I decided to copy it to Fusion (browse the data directly on Fusion here).
Example
Here’s the finished app. Here’s a screenshot, showing all the routes between all US cities and the performance and number of flights for each carrier. 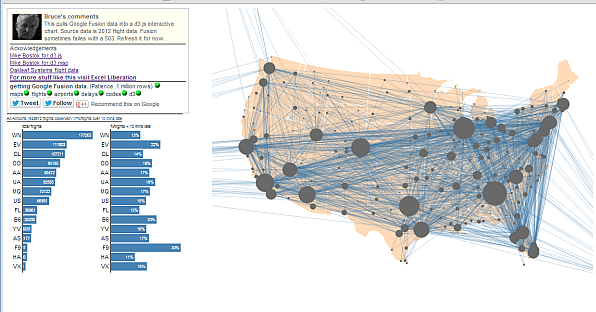 Hovering over a city will highlight all routes from that city, along with the carrier performance for that city
  Hovering over a route will do the same thing for that route. Here’s the JFK to San Diego route, along with the number of flights per carrier and the %ages of their flights that arrived more than 10 minutes late.
  Hovering over one of the bars will reveal the carriers full name, and show all the routes they fly. Here’s all the routes that FL (airtran) flew in 2012
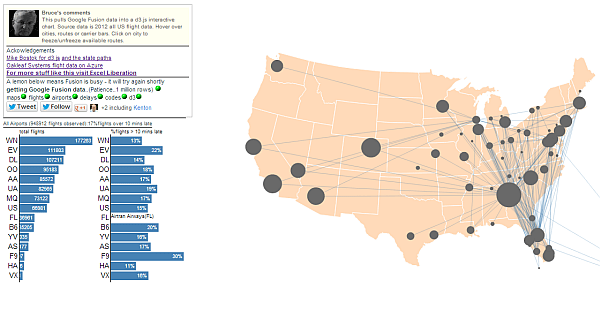
Clicking on a city (as opposed to hovering over it) will ‘freeze that city’, meaning that only routes involving that city will be shown until you unfreeze it. You can release the freeze by clicking on the city again, or by clicking on another city. In the example below, Tuscon has been frozen, and Delta Air is hovered over – so you can see where delta flies to Tuscon from.

Other info
There’s a summary blog post about this app on the Excel Liberation Blog
Exponential backoff
Since the source data here is a) very large and b) coming from cloud based Google Fusion tables, the time taken to load is unpredictable, as is the reliability and performance of the Fusion API. To counter this, Google recommends implementing Exponential backoff. Occasionally, you may see a lemon appearing in the data loading status report, as below. 
This means that the backoff process has kicked in and another attempt at retrieving the Fusion data will be made shortly. In my tests so far, the backoff has worked fine and always been successful in eventually getting all the data.
jQuery promises
Multiple queries on large datasets can certainly benefit from asynchronicity, and in fact each of the 5 separate data sets used in this visualization are kicked off at the same time . I’m using jQuery promises to orchestrate this, as I’ve done in previous examples such as Common query code. How to implement jQuery promises along with exponential backoff is covered in this Excel Liberation Blog post and you’ll see the code for it covered below.
Proxy
Since some of the data is coming cross origin, I needed to use a proxy to wrap JSON around it using an Apps Script webapp. To see how, take a look at Apps Script as a proxy
Technologies used
This was created with D3, Google Fusion API, jQuery and promises amongst other things. The data came from multiple places, most notably Oakleaf Systems and Mike Bostock.
The App
Play with the App here. It takes a little while to load. The source table had about a million rows.
The code
For more on this , see GAS and sites and d3.js. For help and more information join our forum, follow the blog or follow me on twitter .