Yesterday I showed how to do some data wrangling in VBA and Google Apps Script that Tony Hirst on his oUseful blog had done using scraperwiki, Open refine plus various APIs. Today he posted a quick analysis using gephi and scraperwiki on which candidates supported each other in a local Election.
Here’s how to do the same thing using VBA and D3.js.
The whole thing
I already have all the components – scraperwiki to Excel and creating d3.js force diagrams from Excel. So I just needed a couple of lines of code to pull it all together.
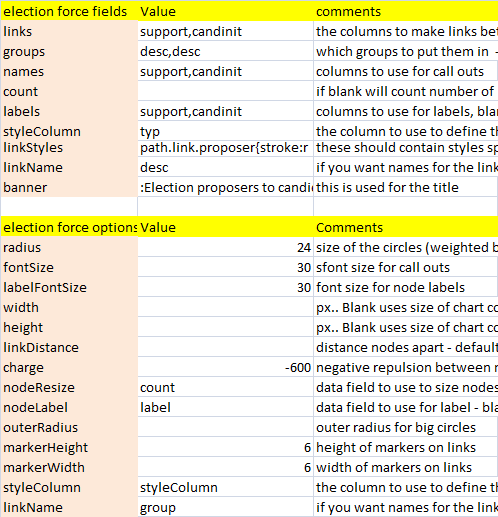
Public Sub ousefulSupportMashup()
    ' thanks to tony hirst for the data and method.
    ' http://blog.ouseful.info/2013/05/08/to-what-extent-do-candidates-support-each-other-redux-a-one-liner-thirty-second-route-to-the-info/


    Dim worksheetName As String, scraperName As String, sqlString As String
    worksheetName = "supportElection"
    scraperName = "iw_poll_notices_scrape"

 ' candidates that support each other
    sqlString = _
        "select * from support where support in (select candinit from support)"


    ' get data from Tony's scraperwiki and populate sheet -
    ' this time from the support table
    scraperWikiStuff scraperName, worksheetName, sqlString


    ' do a force d3.js diagram
    d3ForceDo worksheetName, "election force options", "election force fields"


End Sub
and here’s the result
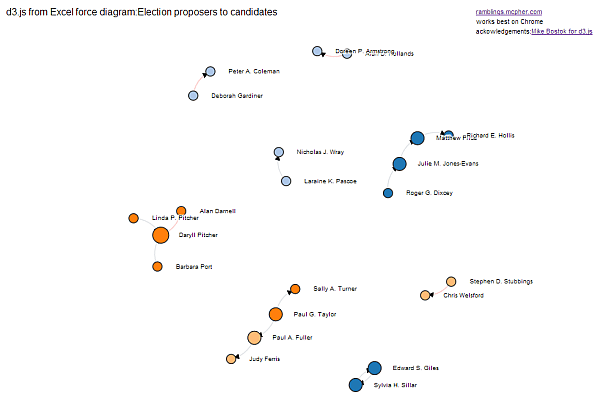
You can see it live here
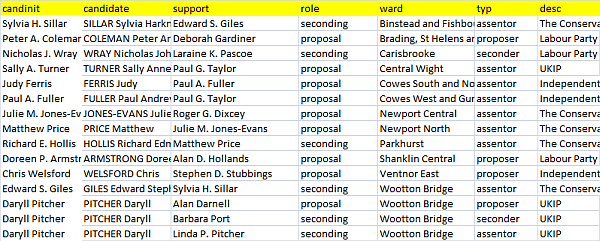
.. created from this data (candidates who supported other candidates) retrieved from scraperwiki
oh .. and of course we need to tweak a few parameters, as described in d3.js force diagrams from Excel.