Today’s post pulls together a number of concepts I’ve been playing around with lately. As usual my source data and post theme is based on data associated with color schemes – pantone, paint colors etc as I’ve covered in numerous posts, including this one
The main components are –
- Parse.com – this is where the color scheme data is stored.
- jQuery promises – to manage the various asynchronous stuff going on
- Color Maths – for comparing closeness of colors
- Google Apps Script – although this is a javaScript app that runs locally, many of the scripts are actually held in Google Apps Script. They are pulled down and run in the browser. This is certainly less efficient than hosting them on a web site, but it does illustrate the technique for using the same code in GAS and javaScript
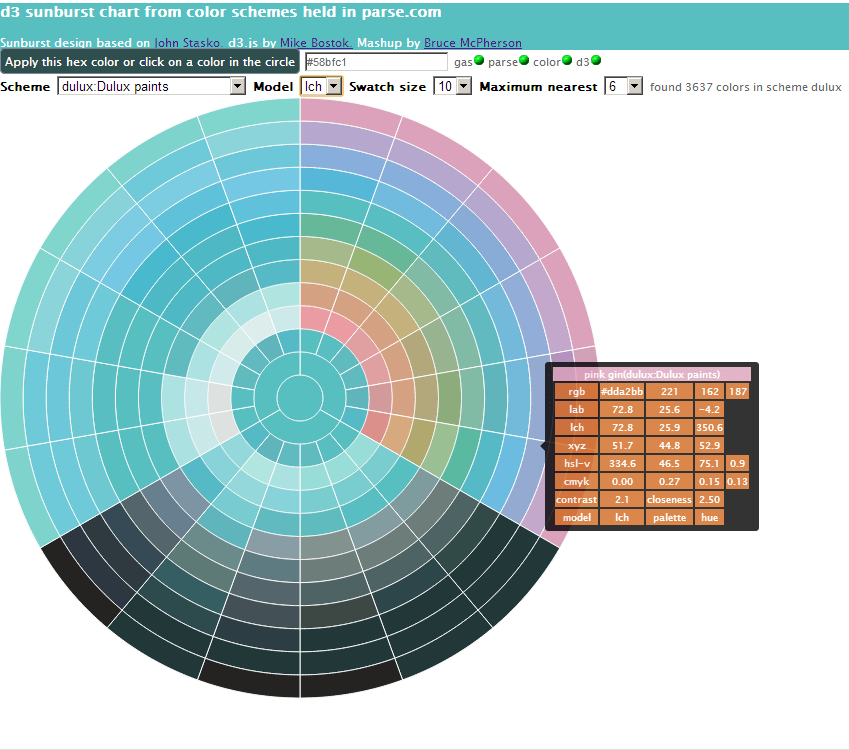
- d3.js – for creating the partition chart used to present the content
Here’s a snap of the kind of chart created
Usages
This is just a mashup to play around with some of these components of course, but you could use this for example, to create palettes built on specific color schemes. It works by calculating the nearest colors to a given target that exist in a given scheme, and then creates various palettes for each one – selecting colors that exist in the scheme that are closest to the ideal color calculated for the palette
Livc Example
You can play around with the live example here, by changing some of the parameters, or hovering over or clicking on some color in the chart
The full story and the code can be found on the xLiberation site.