Apps Script

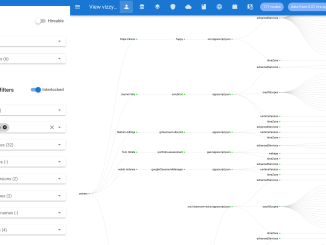
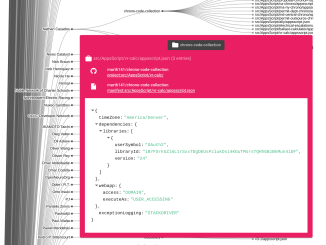
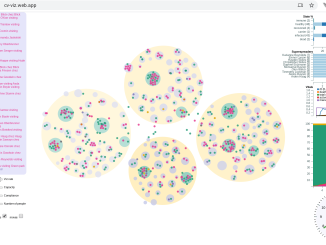
Create GraphML markups from Apps Script

A recent social network analysis project meant I had to find a way to convert Google Form data for visualization in NodeXL. Normally I’d use D3 for this kind of thing (you’ll find plenty of […]

info card on hover or click
Apps Script

4 ways to customize scrviz info card behavior

Info Card customization By default the info card appears when you hover over a node in the scrviz visualization. Although the info card is they key tool for investigating scrviz entries, it can be annoying […]

Apps Script

Enrich your developer profile on scrviz

In Showcase your Apps Script work and get hired via vizzy I showed how scrviz could be used to show off your Apps Script work to potential clients, so they could see what kind of […]

gapi and vuex
Apps Script & Java Script

Google gapi, Vue and Vuex together

JavaScript authentication with Gapi is both impressive and frustrating. Frustrating because in most of the examples you come across, and indeed in Google’s own guides, gapi is the center of the universe.  They are about […]

D3

cv-viz: Virus infection simulation with D3.js

The coronavirus is with us, and naturally, there’s much interest in data on its mortality, reach and spread, and of course much discussion on lockdowns, health capacity, social distancing and how they might affect those […]

Apps Script & Java Script

Using Google Visualization DataViews

javaScript: creating google visualization Data Views This relates to Data Driven Mapping applications and the Javascript ‘HowTo’ section Google Visualization dataViews As mentioned in Using Google Visualization DataTables a master google DataTable is created for all data in […]

No Picture
Apps Script & Java Script

Using Google Visualization DataTables

javaScript:creating google visualization DataTables This relates to Data Driven Mapping applications and the Javascript HowTo section Google Visualization Tables I have covered Google Visualization in various forms with an ‘Excel slant’ on this site. Let’s take a look […]

D3

Emulating worksheet functions in apps script with d3

For setting up D3Gas you’ll need the library, and for background on D3 and Apps Script read Using D3 in server side Gas Set up You’ll need the d3Gas library.  1vZzEtFKAG_PHn44HgEdSBave5NQ-SprisJ0Ngid0ovahwEOMkBO1s6DX Then you can do this […]

No Picture
D3

Using D3 in server side Gas

There are plenty of examples on this site of using D3 for its visualization capabilities, whether from Excel, Apps Script or some other platform. I like D3 a lot, and now with the release of […]

Apps Script & Java Script

Google Visualization API data

The source data colorTable we want to load to our parse.com database is currently in a Google Spreadsheet. With scriptDB, we can access it directly. However,  to load data into parse we need to use the google visualization query […]

Apps Script & Java Script

Using Google Visualization charts and tables

javaScript: creating google visualization charts and tables This relates to Data Driven Mapping applications and the Javascript HowTo section Google Visualization tables and charts All visualizations are created from the dataViews mentioned in Using Google Visualization DataViews. Once […]

Visualization

Adding markers to Ovi Maps from Excel

Put addresses on a map as markers We’ve already looked at how to geoCode addresses using various APIs and how to create maps with Google Maps from Excel data.  Now let’s look at using Bing Maps  to put […]

No Picture
Apps Script & Java Script

HTML service without caja

If you are reading this in 2015, you probably won’t have come across caja, since you’ll be using this, as was announced today var html = HtmlService.createHtmlOutputFromFile(‘foo’); html.setSandboxMode(HtmlService.SandboxMode.IFRAME); For those of us still in 2014, this […]

No Picture
D3

Focus node explorer with d3.js

There’s a lot of different things going on in this topic. Most of them have been covered before, and lead to this mashup, but I am introducing a new kind of d3 chart (for me […]

No Picture
D3

D3 force from GAS Site

In Site data to sheets i showed how to get basic data from Analyzing site content with GAS into Excel and Google Sheets. To be able to use Excel tables to d3.js Force diagram, we are going to focus on […]

No Picture
Apps Script & Java Script

Zoomable Partition Charts

How to create a d3 zoomable partition chart straight from Excel. As always, acknowledgement to Mike Bostock on whose zoomable partition chart this is based.  A partition chart is a way of showong heirarchical data. The zoomable part is […]

No Picture
D3

Making sense of joins in D3

I come back to D3 about once every 6 months, and every single time I’ve forgotten how joins work. To avoid that next time, I’m writing it down to explain to myself, and hopefully you […]

No Picture
D3

Flight data from Fusion

I’ve been playing around with the live integration of large cloud based data sets with D3.js. Most visualizations with D3 use some kind of static data, but I became interested in pulling different source into d3. […]

No Picture
Apps Script & Java Script

Developer information for d3.js force diagrams

To develop Excel applications that generate web pages incorporating d3.js force diagrams from Excel data, first read this Excel tables to d3.js Force diagram. You will also need to be familiar with How to use cDataSet and How to […]

No Picture
Apps Script & Java Script

Adding markers to d3.js force diagrams

How to add markers to links In Excel tables to d3.js Force diagram I showed how to create a basic force diagram. Since that time, I’ve added the capability to add markers (arrows) to the end of […]

No Picture
D3

Excel tables to d3.js Force diagram

How to create d3.js force diagrams from  excel tables In Sankey diagrams from Excel and Creating d3.js Tree diagrams the input data for these d3.js visualizations was of a specific layout. We are now going to look at a more generalized […]

No Picture
D3

Eurovision results with crossfilter and dc.js

Since the 50’s, there has been an annual song contest involving many European countries. It’s a fairly bizarre event, but one of the most interesting things about it is the voting system. Countries vote for […]

No Picture
Apps Script & Java Script

Creating d3.js Tree diagrams

Acknowledgement d3.js is from Mike Bostok’s site. If you use any of this material, please be sure to maintain the acknowledgement for his work. I also found out how to create tree diagrams on Pavan Podila’s blog. […]

D3

Big quiz score reports

‘m showing score reports for the BigQuiz app. This is an individual players score compared to the maximum he could have got as well as the number of questions that were correctly answered, and also comparing […]

D3

Quick doughnut and pie charts with a radial timer

If you’ve been trying out the Configurable circular timer with D3 or playing around with Example of clock using d3 configurable timer you’ll have seen how easy it is to create a versatile timer by just configuring a few […]

No Picture
D3

Example of clock using d3 configurable timer

In Configurable circular timer with D3 I showed a circular timer made with D3.js . Although it’s not really what it’s for, this simple example shows how to make a complex viz. This is a clock […]

No Picture
D3

Configurable circular timer with D3

I don’t use jQuery, neither in regular webapps nor in Apps Script HtmlService apps. No particular reason – I just prefer to use vanilla JavaScript. I often use d3.js, mainly for visualization as in these examples elsewhere […]

No Picture
Apps Script & Java Script

Color scheme explorer

In this section, we’ll build an application that pulls together many concepts already covered elsewhere on this site. You can run it standalone at xliberation.com, or below, embedded in this page  The target application Pulling together Playing […]

No Picture
Apps Script & Java Script

d3.js and parse mashup

This is an interesting d3.js and parse.com mashup of a number of topics covered on this site. The target is to build an app that Retrieves color scheme data from a parse.com database, much like […]

Visualization

University Rankings visualized

Using the Guardian UK university 2014 rankings to demonstrate, here’s how to mashup a few bits and pieces to visualize them. This is pretty generalized, so can be applied to any data set with fairly minimal changes. […]

Google Visualization

Google Visualization

Create Google visualizations straight out of Excel. Here you can download a prebuilt application, googleCharts.xlsm that demonstrates how to integrate google Visualizations with Excel. The subsequent pages are about how to develop such an application […]

No Picture
Apps Script & Java Script

Configurable canvas meter

Here’s a very simple, but nice looking meter in JavaScript. It’s configurable for a number of uses. There’s no need for any css (styling is by configuration) or additional libraries (it uses Chroma-js), as everything […]

No Picture
Add-ons

Chord Snip

Chord snip is an add-on for Google Sheets that creates a Chord diagram as you type, gives you the SVG code to embed it in a web site and the ability to embed it in […]

No Picture
Apps Script & Java Script

Sankey diagram from Excel

Acknowledgement Much of the JavaScript and d3.js came from Mike Bostok’s site. If you use any of this material, please be sure to maintain the acknowledgement for his work. There have been a few features added […]

No Picture
D3

d3.js

What is d3.js d3.js is a javaScript library that provides a ‘declarative framework’ for DOM manipulation and simplified access to SVG. d3 is the work of Mike Bostok and you should spend some time taking a look at […]

No Picture
Colors

Coloring maps and other shapes

In Using Google Maps I covered how to create various web based interactive maps. Of course many would like to use Excel to create maps, and the topic of chorpleth maps, has been covered many times by […]

No Picture
Apps Script & Java Script

Concept browser for site navigation with d3

I recently posted about a way to navigate sites and blogs by topic using a d3.js force diagram. Following that I was thinking some more about the trend away from organizing data into predefined folders […]

No Picture
D3

Playing around with Tableau Public

With Tableau, you can do loads of visualizations very simply and publish them on “tableau public”. I never tried Tableau before, so I downloaded the tableau public software to play around with. The other day, […]

No Picture
D3

parse.com and d3.js mashup

Today’s post pulls together a number of concepts I’ve been playing around with lately. As usual my source data and post theme is based on data associated with color schemes – pantone, paint colors etc […]

No Picture
Visualization

Shopping with scoop.it

I’ve recently started to use scoop.it to pull together updates from this blog and the related site, along with anything else I find interesting or useful. It really is a nice way to curate things to […]

No Picture
Apps Script & Java Script

visualizing system integrations using d3.js (straight from Excel)

I’ve written about d3.js force diagrams, mapping tweet sentiments, , d3.js trees, Sankey diagrams and various other stuff on the ramblings site all of which show how to create d3.js diagrams directly from simple Excel data. This is settling […]

No Picture
Visualization

Filtering Google Map markers by categories

On the ramblings site, you will find lots of downloadable examples and explanations dealing with connecting Excel to Google Maps and Earth. Following numerous requests on our forum, here’s how to filter google markers according […]

No Picture
VBA

Create tag Clouds from twitter in Excel

The tagCloud class Today’s post will demonstrate how to generate tagClouds from various sources in Excel. As an example we will use some tweets retrieved by the rest- Excel library A ‘Mitt Romney’ type query generates this tagCloud […]

No Picture
REST API

TweetSentiments now in the cRest Excel library

Interpreting sentiment from phrases. I came across http://tweetsentiments.com/ the other day, which is a service that tries to analyze the sentiment expressed in a phrase. The are using a technique called Support Vector machines.  You can read […]

No Picture
Visualization

How to use the Excel Roadmapper

Excel Roadmapper from simple table data Some time ago, I showed how to develop a VBA roadmapper on the ramblings website. I’ve noticed that most of my visitors to that topic simply download the finished workbook […]

No Picture
Deprecated

Repository for VizMap generated applications

What are generated VizMap applications These are mapping applications integrating Google Maps, Google Earth, Google Visualizations and Twitter. Here is an example screenshot. They are data driven in the sense that the applications are generated […]

No Picture
Deprecated

Flying around Google Earth Markers

In last weeks blog entry, I showed how to generate a Google Earth or Google Maps based application out of Excel. These applications now have the capability to fly around each marked entry in Google […]

No Picture
Deprecated

Creating Data Driven Mapping applications

Creating Data Driven Mapping applications In a previous post I looked at the the various mapping packages and how they compared. Having concluded that Google Maps was the winner, I started to work on an […]

No Picture
Google API

Comparing Bing, Ovi, Yahoo and Google Maps

Geocoding Excel While looking at how to connect Excel to Google Maps,  I implemented a capability in vba for each of the main Apis for geoCoding capability through a simple http: request. You can read […]

No Picture
Visualization

Google Maps versus Bing Maps

In a previous post I covered how you could use the Google Maps Api to complete and parse addresses for subsequent mapping directly from Excel. In the name of fairness, I implemented the same thing […]

No Picture
Integrating Excel with Maps and Earth

Getting data from Google Maps to Excel

Mapping visualization layers from Excel The Google Maps API is a wonderful thing, allowing you to convert an unstructured and incomplete address and get back a whole bunch of structured and mapping data. Google is […]

No Picture
VBA

Roadmapper now hosted on google Code

Using google code to host projects I moved the gadget and associated code to googlecode.com hoping to host it there. If you have never done this, it is somewhat complex. It can be found here. […]

No Picture
VBA

Implemented Roadmapper as a Google Gadget

Roadmapper update I finally got round to implementing the roadmapper as a google visualization gadget. All the source code and gadget package is available here along with the write up, so I wont repeat it […]

No Picture
VBA

Adding Callouts to Roadmaps

Roadmap Project Recap Some time ago I started to play around with a method to make Roadmaps from Excel data. Since working through the development of it  on my Excel Ramblings site and in this article […]