For setting up D3Gas you’ll need the library, and for background on D3 and Apps Script read Using D3 in server side Gas
Set up
You’ll need the d3Gas library.
1vZzEtFKAG_PHn44HgEdSBave5NQ-SprisJ0Ngid0ovahwEOMkBO1s6DX
Then you can do this
var d3 = d3Gas.d3;
Sheets worksheet functions
Unlike Excel and VBA, you can’t get at worksheet functions from Apps Script. However D3.js has some useful functions that operate on arrays just like some of the Sheets built in functions. To demonstrate I’ve implemented a few below.
function tryD3() {
  var d3 = d3Gas.d3;
  var ss = SpreadsheetApp.getActiveSpreadsheet();
  var sheet = ss.getSheetByName('input');
  var results = [];
  var resultSheet = ss.getSheetByName('results');
  var values = sheet.getDataRange().getValues();
  var dataValues = values.map (function(d) {
    return d.slice (1, d.length);
  }).slice(1,values.length);
  results.push (['arrays','min', d3.min (dataValues[0]) ,'1st row']);
  results.push (['arrays','max', d3.max (dataValues[0]) , '1st row']);
  results.push (['arrays','extent', d3.extent (dataValues[0]).join("-"),'1st row']);
  results.push (['arrays','sum', d3.sum (dataValues[0]) , '1st row']);
  results.push (['arrays','mean', d3.mean (dataValues[0]) , '1st row']);
  results.push (['arrays','median', d3.median (dataValues[0]) , '1st row']);
  results.push (['arrays','quantile', d3.quantile (dataValues[0],.25) , '1st quartile']);
  results.push (['arrays','variance', d3.variance (dataValues[0]) , '1st row']);
  results.push (['arrays','deviation', d3.deviation (dataValues[0]) , '1st row']);
  results.push (['arrays','min', d3.min (d3.merge(dataValues)) ,'merged data']);
  results.push (['arrays','max', d3.max (d3.merge(dataValues)) , 'merged data']);
  results.push (['arrays','extent', d3.extent (d3.merge(dataValues)).join("-"),'merged data']);
  results.push (['arrays','sum', d3.sum (d3.merge(dataValues)) , 'merged data']);
  results.push (['arrays','mean', d3.mean (d3.merge(dataValues)) , 'merged data']);
  results.push (['arrays','median', d3.median (d3.merge(dataValues)) , 'merged data']);
  results.push (['arrays','quantile', d3.quantile (d3.merge(dataValues),.5) , 'merged data']);
  results.push (['arrays','variance', d3.variance (d3.merge(dataValues)) , 'merged data']);
  results.push (['arrays','deviation', d3.deviation (d3.merge(dataValues)) , 'merged data']);
  resultSheet.getRange (2,1,results.length, results[0].length).setValues(results);
}
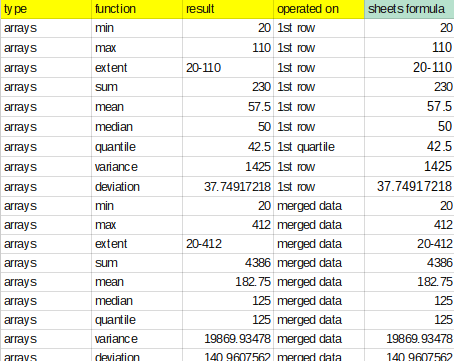
And the results are this – the final column is the result using the built in worksheets to see that they match the d3 generated results in the ‘result’ column.
d3.merge
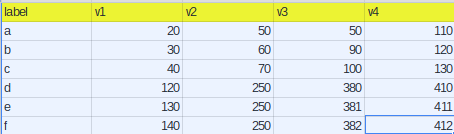
d3 operates on a single array, so passing a range with multiple rows isn’t going to work. However, d3.merge() can be used to combine a range like b2:e7 into a single array so that things like d3.sum() work across the whole range., as in the example below (where values holds the matrix of values from range b2:e7)
var result = d3.sum(d3.merge(values));
is equivalent to
=SUM (b2:e7)
quantile
D3 has d3.quantile()where you can specify any quantile between 0 and 1, so d3.quantile(values,0.25) should be equivalent to =QUARTILE(range,1) but I’m not getting consistent results from it – I don’t know why yet – there are multiple ways of calculating a quantile so i need to look at this some more, but the other formulas work perfectly.
and that’s all folks..