Here’s a very simple, but nice looking meter in JavaScript. It’s configurable for a number of uses. There’s no need for any css (styling is by configuration) or additional libraries (it uses Chroma-js), as everything required is packaged up in one module.
Where to get it
Getting started
node
npm install canvas-meter --save
require it
const CanvasMeter = require ("canvas-meter");
script tag
<script src="https://storage.googleapis.com/xliberation.com/canvas-meter/canvas-meter-v1.0.min.js"></script>
Examples
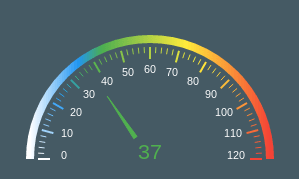
A speedometer
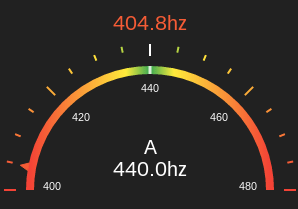
A guitar tuner
Fine tune your own interactively on Codepen
API
Create a canvas element
<canvas width="300" height="210" id="meter"></canvas>
Pass it to an instance of the meter
const meter = new CanvasMeter(document.getElementById("meter"));
Update it when you want
meter.draw(currentValue,lowValue,highValue,idealValue,label);
Configuration
Most aspects of the meter are configurable.
Defaults
The defaults are for a guitar tuner and look like this.
let options = {
    meter: {
      ramp:[
        {stop:0, color:'#F44336'},
        {stop:.4,color:'#FFEB3B'},
        {stop:.49,color:'#4CAF50'},
        {stop:.5,color:'#FFFFFF'},
        {stop:.51,color:'#4CAF50'},
        {stop:.6,color:'#FFEB3B'},
        {stop:1,color:'#F44336'}
      ],
      colors: {
        background:'#212121',
        label:'#FFFFFF',
        tickLabel:'#FAFAFA'
      },
      offsets: {
        ideal:-14,
        value:-160,
        label:-36,
        meter:-20,
        tickLabel:22,
        tick:-26,
        pointer:-12
      },
      ticks: {
        major:{
          height:12,
          width:2,
          count:5
        },
        minor:{
          height:6,
          width:2,
          count:3
        },
        pointer: {
          height:8,
          width:28
        }
      },
      fonts: {
        label:'24pt sans',
        tickLabel:'8pt sans',
        ideal:'16pt sans',
        value:'16pt sans',
      },
      formatters: {
        value:(v) => typeof v===typeof undefined ? "" :`${v.toFixed(1).toString()}hz`,
        ideal:(v) => typeof v===typeof undefined ? "" : `${v.toFixed(1).toString()}hz`,
        label:(v) => typeof v===typeof undefined ? "" : `${v.toString()}`,
        tickLabel:(v) => typeof v===typeof undefined ? "" : `${Math.round(v).toString()}`,
      },
      arc: {
        size:.8,
        width:8
      }
    }
  };
Example
Here’s the skin for the speedometer example. Any properties not mentioned here are picked up from default
const getSpeedoSkin = () => {
  return {
    meter:{
      offsets:{
        tick:8,
        tickLabel:34,
        value:0,
        pointer:44
      },
      ramp:[
        {stop:0, color:'#FFFFFF'},
        {stop:.2,color:'#2196F3'},
        {stop:.3,color:'#4CAF50'},
        {stop:.65,color:'#FFEB3B'},
        {stop:1,color:'#F44336'}
      ],
      colors:{
        background:'#455A64'
      },
      ticks:{
        major:{
          count:13
        },
        minor: {
          count:4,
          width:1
        },
        pointer: {
          height:50,
          width:8
        }
      },
      formatters: {
        value: function (v) { return Math.round(v.toString())},
        ideal: function (v) { return "";}
      }
    }
  };
};
Use it like this
const meter = new CanvasMeter(document.getElementById("speedo"));
  meter.setOptions (getSpeedoSkin());