This can be used on both server and client side.
New features
If you’re looking for the new feature for tolerating a certain amount of blankness in a table, it’s written up at the end of this post.
The messy sheet
sheet.getDataRange()
is fine if you have one table starting at row 1 column 1, but lets say you have a mess like this on a sheet, and you want to separate all this into discrete data tables.
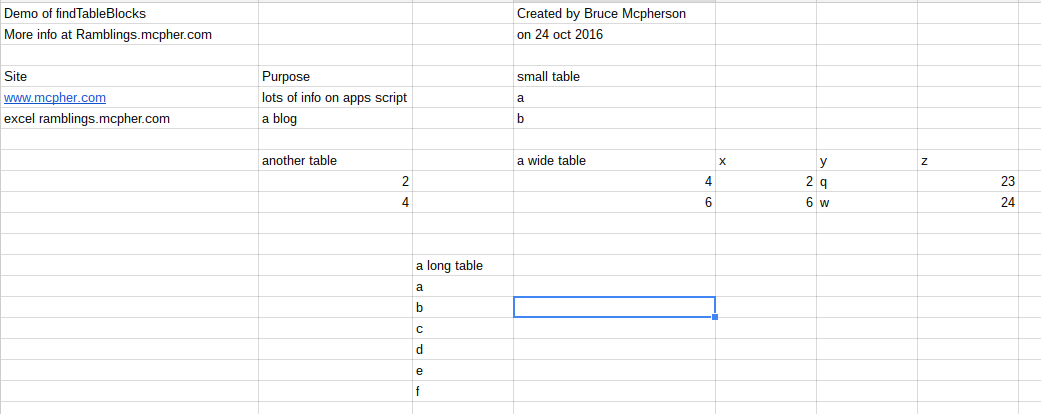
This post is about how to easily do that, to select the data from the various table, and to dynamically track a table as it resizes or moves.
How to use
The code is in the cUseful library. Here’s the key, and it’s also on github
1EbLSESpiGkI3PYmJqWh3-rmLkYKAtCNPi1L2YCtMgo2Ut8xMThfJ41Ex
Analyzing a sheet
In its simplest form, findTableBlocks works like this. It will analyze all the blocks of data it can find on a sheet and return where they are. It also selects one of the blocks as the one you probably want, and gives you the values and other info on what’s there.
var values = SpreadsheetApp.getActiveSheet().getDataRange().getValues();
Logger.log(cUseful.Utils.findTableBlocks(values));
Here’s what an App using this can do. In this example, I have an onEdit function which continually assesses the sheet and changes the formatting for each block of data. It picks one of the blocks as the likely table (more on how to tweak that later), and maintains the sheet like this as data is modified by the user. You can see that it has highlighted each table, and selected the one named ‘a wide table’ as the one you probably want.
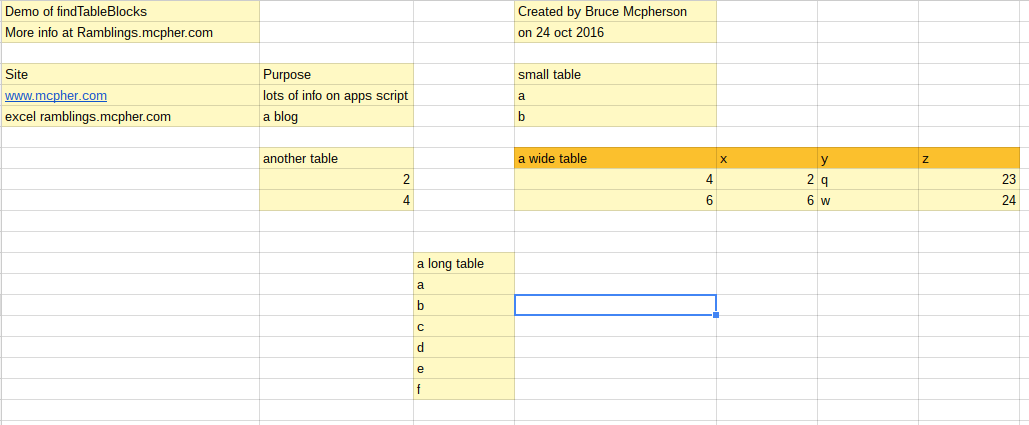
The code for doing this is super simple…
/**
 * onEdit for interactive test
 *
 */
function onEdit () {


  // get the values of the current sheet
  var sheet = SpreadsheetApp.getActiveSheet();
  var values= sheet.getDataRange().getValues();


  // find all the blocks of data
  var tables = cUseful.Utils.findTableBlocks(values);

  // clear all the formatting
  sheet.clearFormats();

  // show all the tables found
  tables.blocks.forEach(function (d) {
    sheet.getRange(d.a1Notation).setBackground("#FFF9C4");
  });


  // lets use a different color for the selected table header
  sheet.getRange(tables.selected.block.a1Notation)
  .offset(0,0,1,tables.selected.block.size.columns)
  .setBackground('#FBC02D');


  // The values can be found in tables.selected.values
  // and the range in tables.selected.block.a1Notation


  }
The Tablesblock object.
Let’s look in a little more detail at the result of calling findTablesBlocks(values)
{
 "blankRows": [2, 6, 10, 11, 19],
 "blocks": [{
 "start": {
 "row": 0,
 "column": 0
 },
 "size": {
 "rows": 2,
 "columns": 1
 },
 "a1Notation": "A1:A2",
 "cells": 2,
 "position": 0
 }, {
 "start": {
 "row": 0,
 "column": 3
 },
 "size": {
 "rows": 2,
 "columns": 1
 },
 "a1Notation": "D1:D2",
 "cells": 2,
 "position": 1
 }, {
 "start": {
 "row": 3,
 "column": 3
 },
 "size": {
 "rows": 3,
 "columns": 1
 },
 "a1Notation": "D4:D6",
 "cells": 3,
 "position": 3
 }, {
 "start": {
 "row": 7,
 "column": 1
 },
 "size": {
 "rows": 3,
 "columns": 1
 },
 "a1Notation": "B8:B10",
 "cells": 3,
 "position": 4
 }, {
 "start": {
 "row": 3,
 "column": 0
 },
 "size": {
 "rows": 3,
 "columns": 2
 },
 "a1Notation": "A4:B6",
 "cells": 6,
 "position": 2
 }, {
 "start": {
 "row": 12,
 "column": 2
 },
 "size": {
 "rows": 7,
 "columns": 1
 },
 "a1Notation": "C13:C19",
 "cells": 7,
 "position": 6
 }, {
 "start": {
 "row": 7,
 "column": 3
 },
 "size": {
 "rows": 3,
 "columns": 4
 },
 "a1Notation": "D8:G10",
 "cells": 12,
 "position": 5
 }],
 "selected": {
 "block": {
 "start": {
 "row": 7,
 "column": 3
 },
 "size": {
 "rows": 3,
 "columns": 4
 },
 "a1Notation": "D8:G10",
 "cells": 12,
 "position": 5
 },
 "values": [
 ["a wide table", "x", "y", "z"],
 [4, 2, "q", 23],
 [6, 6, "w", 24]
 ]
 }
 }
| Property | What is it |
| blankRows | An array of row offsets that contain completely blank rows |
| blocks | An array of [block] which describe each unique block of data. Any of these blocks could be considered to be a table. Each block contains properties about the size, position and range of each of the potential tables |
| selected | contains a repeat of which of the blocks is best qualified to be a table, and also the values are extracted out for that section. |
Modifying the selection criteria
Of course you can examine the blocks and decide for yourself which is the most tableworthy, but you can also provide some options to have it done automatically, the code below will select the 3rd block as the most tableworthy.
var tables = cUseful.Utils.findTableBlocks(values, {
    mode:'position',
    rank:3
	});
The mode can be ‘cells’ or ‘position’. cells uses the number of cells in the block, and position the position of the block in the sheet. The rank is used to say which one to pick. A rank of 0 means pick the table in the last position, or the one with the most cells, so the default is equivalent to, this – which will pick the biggest table.
var tables = cUseful.Utils.findTableBlocks(values, {
    mode:'cells',
    rank:0
	});
New feature
I’ve added a new feature to be able to include tables with some blank rows and columns.
Let’s say you have a sheet like this.
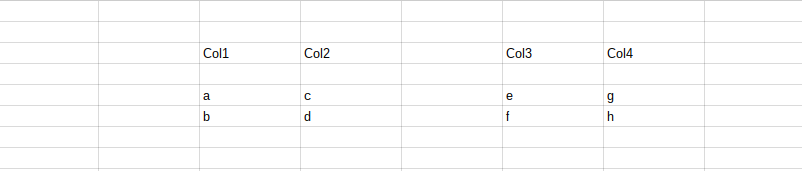
By default, findTableBlocks will consider this as 4 separate tables, and will return this as the selected table description when called like this
Utils.findTableBlocks (values);
result
{
 "selected": {
 "block": {
 "start": {
 "row": 4,
 "column": 5
 },
 "size": {
 "rows": 2,
 "columns": 2
 },
 "a1Notation": "F5:G6",
 "cells": 4,
 "position": 3
 },
 "values": [
 ["e", "g"],
 ["f", "h"]
 ]
 }
 }
However it is possible that blank rows and columns have been inserted for formatting purposes, and that this should instead be considered as a single table.The options rowTolerance and columnTolerance can be used to specified how many blank rows and columns can be tolerated before a table is considered to be a separate entity. This tolerance only applies to embedded blank rows and columns. Leading and trailing blank rows and columns are never included in a table, regardless of the row and column tolerance settings. Here’s how to deal with tables with some embedded blank rows and columns.
Utils.findTableBlocks (values, {
      rowTolerance:1,
      columnTolerance:1
	  } );
result
{
 "selected": {
 "block": {
 "start": {
 "row": 2,
 "column": 2
 },
 "size": {
 "rows": 4,
 "columns": 5
 },
 "a1Notation": "C3:G6",
 "cells": 20,
 "position": 0
 },
 "values": [
 ["Col1", "Col2", "", "Col3", "Col4"],
 ["", "", "", "", ""],
 ["a", "c", "", "e", "g"],
 ["b", "d", "", "f", "h"]
 ]
 }
 }
cUseful
The cUseful library contains this and many other things posted around this site.
Here’s the key, and it’s also on github
1EbLSESpiGkI3PYmJqWh3-rmLkYKAtCNPi1L2YCtMgo2Ut8xMThfJ41Ex
Why not join our forum, follow the blog or follow me on twitter to ensure you get updates when they are available.