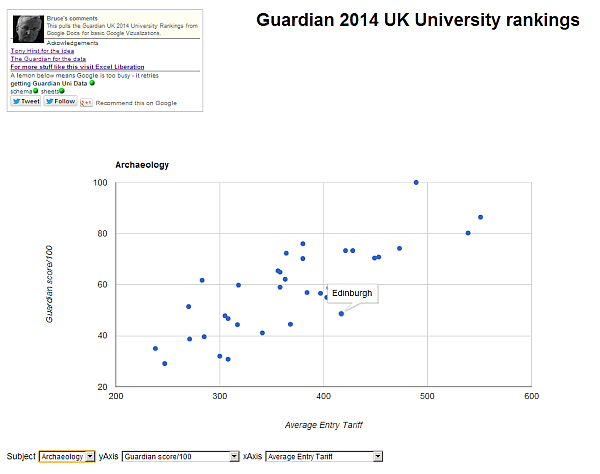
Using the Guardian UK university 2014 rankings to demonstrate, here’s how to mashup a few bits and pieces to visualize them. This is pretty generalized, so can be applied to any data set with fairly minimal changes.
- Google Visualization Views and Charts – to retrieve, organize and present the data
- jQuery promises – to orchestrate asynchronous data access
- Exponential backoff – to avoid failures when Google API is too busy
The app
You can find it here. The data is spread across many Google Docs Spreadsheets so it takes a while to load.
Loading the data
function getSheetInfo(light) {
        // note that spreadsheet must be published before you can do this as json
        // this will return the spreadsheet schema info
        var key = "0At2ExLh4POiZdFd0YUhpZVRPUGxFcW85X2xkMm1vY2c";
        var url = "https://spreadsheets.google.com/feeds/worksheets/" + key + "/public/basic?alt=json";
        var proxy;
        return getPromiseData(url,proxy,light);
    }
This will tell us what worksheets to retrieve, along with the variety of fetch URL needed to get the data in a format suitable for input to a Google Visualization DataTable- which allows us to retrieve each sheet as follows.
function getSheetData(package) {
        // we have the schema, get all the data
        // this will create an array of promises, one for each worksheet
        var entries = package.info.feed.entry, sheetPromises = [];
        for ( var i= 0 ; i < entries.length ;i++) {
            var p =  getTheDocsData(entries[i]);
            sheetPromises.push(p);
            p.done (function (data) {
                package.sheets.push (data);
            });
        }
        return sheetPromises;
    }
function findVizLinkEntry (links) {
        // there are several versions of the link for each worksheet
        // we'll use the google vizualization one.
        for (var i=0; i < links.length; i++ ) {
            if (links[i].rel.match(/visualizationApi/)) return links[i].href;
        }
        alert ("cant find viz link");
    }
function getTheDocsData ( entry , light) {
        var deferred = $.Deferred();
        var h = findVizLinkEntry(entry.link);
        var query = new google.visualization.Query(h);
        // get all columns
        query.setQuery('SELECT * options no_format');
        query.send(function (response) {
            if (response.isError()) {
                deferred.reject('Error in query: ' + response.getMessage() + ' ' + response.getDetailedMessage());
                if (light) makeLight(light,'failed');
            }
            else {
                deferred.resolve(
                    {   entry:entry,
                        data:response.getDataTable(),
                        name: entry.title['$t'].replace(/\d*\s*/,"")
                    });
                if (light) makeLight(light,'idle');
            }
        });
        return deferred.promise();
    }
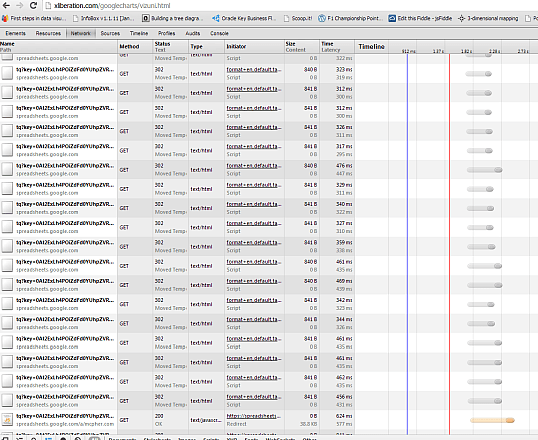
The entire thing is orchestrated through jQuery promises. What’s interesting about this is that we can kick off retrieving all 40+ sheets at the same time, as you can see from the log below
function getTheData() {
        var massage = $.Deferred();
        var package  = {};

        // override any default options here
        package.options = {};
        // all the sheets will end up here
        package.sheets = [];

        getSheetInfo("schema").done( function (info) {
            package.info = info;
            makeLight("sheets","busy");
            var allSheetsPromise = getSheetData(package);
            $.when.apply($,allSheetsPromise)
                .done(function() {
                    // do any data massagin here before resolving
                    package.sheets.sort(function(a,b) {
                        return a.name < b.name ? -1 : (a.name===b.name ? 0 : 1) ;
                    });
                    massage.resolve(package);
                    makeLight("sheets","idle");
                })
                .fail ( function(error) {
                    $('#status').html(error);
                    massage.reject(error);
                    makeLight("sheets","failed");
                });
        });
        return massage.promise();
    }
and throttled with exponential backoff
// general deferred handler for getting json data and creating promise
    function getPromiseData(url,proxyUrl,light){

        var deferred = $.Deferred();
        var u = url;

        if (proxyUrl ) {
                u = proxyUrl+"?url="+encodeURIComponent(url);
        }
        else {
                // if not proxied, needs to be jSONp
                u = u + "&callback=?"
        }

        backOffJson (deferred,u,light);
        return deferred.promise();

    }
function backOffJson (defer,u, light,tries) {
        // uses exponential back off
        tries = tries || 0;
        if(light)makeLight(light,"busy");
        $.getJSON(u, null,
            function (data, textStatus, jqXHR) {
                if (data.error) {
                    if (data.error.code == 503 || data.error.code == 429) {
                        // a 503 error - so i'll back off
                        tries ++;
                        if (tries <= 5) {
                            // try again
                            var hangAroundFor = (Math.pow(2,tries)*1000) + (Math.round(Math.random() * 1000));
                            if (light)makeLight(light,"lemon");
                            setTimeout(function() {
                                            backOffJson (defer,u,light,tries);
                                        },hangAroundFor);
                        }
                        else {
                            defer.reject(data);
                        }
                    }
                    else {
                      defer.reject(data);
                    }
                }
                else {
                    defer.resolve(data);
                }
        })
        .error(function(res, status, err) {
            defer.reject("error " + err + " for " + u);
        });

        defer.promise()
            .done (function () {
                if (light) makeLight(light,"idle");
            })
            .fail( function () {
                if(light)makeLight(light,"failed");
            });

        return defer;
    }
The visualization
One benefit of retrieving the data as google Vizualization DataTables, is the that the visualization (a scatter chart) is a breeze
function doTheViz(control) {

        // create a dataview of the selected columns for scatter plot
        control.xAxisSelected = control.yAxisSelected = -1;

        manageOptionsSubjects(control.options.select.subject.element,control.package.sheets)
            .val(control.options.select.subject.default);
        var chart = new google.visualization.ScatterChart(document.getElementById(control.divName));

        google.visualization.events.addListener(chart, 'ready', function () {
            control.options.selectorElement.css("display","block");
        });
        changeTheView();

        function changeTheView () {
            var select = control.options.select;
            var sheet = findTheData ( control, select.subject.element.val());
            var view = new google.visualization.DataView(sheet.data);

            // because we want to retain the choice from previous sheets
            control.xAxisSelected = control.xAxisSelected == -1 ?
                                        findColumnNumber(select.xAxis.default,sheet) : control.xAxisSelected ;
            control.yAxisSelected = control.yAxisSelected == -1 ?
                                        findColumnNumber(select.yAxis.default,sheet) : control.yAxisSelected ;

            // generate new options
            manageOptions(select.yAxis.element, sheet).val(control.yAxisSelected);
            manageOptions(select.xAxis.element, sheet).val(control.xAxisSelected);

            select.yAxis.element.change(function() {
                updateChartOptions() ;
            });
            select.xAxis.element.change(function() {
                updateChartOptions() ;
            });
            select.subject.element.change(function() {
                changeTheView();
            });

            updateChartOptions();

            function updateChartOptions(){
                control.options.selectorElement.css("display","none");
                // TODO an enhancement to tooltip could be to find the performance data
                // for the instituion in the institution sheet
                control.xAxisSelected = +control.options.select.xAxis.element.val();
                control.yAxisSelected = +control.options.select.yAxis.element.val();
                view.setColumns([control.xAxisSelected,control.yAxisSelected,
                    {sourceColumn:findColumnNumber (control.options.namecolumn, sheet),role:'tooltip'}]);


                var options = {
                    title: control.options.select.subject.element.val(),
                    vAxis: { title : view.getColumnLabel(1) } ,
                    hAxis: { title : view.getColumnLabel(0)  },
                    legend : { position : "none" },
                    animation : { duration : control.options.animationDuration , easing: control.options.animationEasing },
                    height: control.options.height,
                    width: control.options.width
                };
                chart.draw(view,options);
            }
        }
    }
Simply use a selector with values that correspond to the column number in the source table, and create a view with those selected columns from the underlying datatable. Since each sheet is treated separately, there is no need for them to be in the same format or even have the same columns – the selectors and viz are completely data driven.
The code
Here is the whole thing.
<!DOCTYPE html>
<html lang="en">
 <head>
  <meta charset="utf-8" />
  <title>2014 UK Guardian university rankings - ramblings.mcpher.com</title>

  <meta http-equiv="X-UA-Compatible" content="IE=edge,chrome=1" />
  <link rel="stylesheet" type="text/css" href="http://xliberation.com/cdn/css/d3flights.css">
  <script type="text/javascript" src="https://www.google.com/jsapi"></script>
  <script type="text/javascript" src="http://d3js.org/d3.v3.min.js"></script>

  <script type="text/javascript">
  (function () {
    google.load("visualization", "1", {packages: ["corechart","table"]});
    google.load("jquery", "1");
    google.setOnLoadCallback(function() {
        makeLight("uni","busy");
        initialize().done (
            function (control) {
                doTheViz(control);
                makeLight("uni","idle");
            }
        )
        .fail (function(error) {
            alert (JSON.stringify(error));
            makeLight("uni","failed");
        })
    });

    function manageOptions(sel,sheet) {
        // generate new options for regular data
        var o = $('option',sel );
        if(o)o.remove();

        for (var i = 0; i < sheet.data.getNumberOfColumns(); i ++) {
            if( sheet.data.getColumnType(i) == 'number' ) {
                sel.append( $("<option>",
                        {   value: i,
                              text: sheet.data.getColumnLabel(i)
            		    }
                    ));
            }
        }
        return sel;
    }
    function manageOptionsSubjects(sel,sheets) {
        // generate new options for filtering sheets
        var o = $('option',sel );
        if(o)o.remove();

        for (var i = 0; i < sheets.length; i ++) {
            // for the moment just ignore the institutions and specialist tabs as menu options
            if (sheets[i].name != 'Institutions' && sheets[i].name != 'Specialists') {
                sel.append( $("<option>",
                    {   value: sheets[i].name,
                      text: sheets[i].name
        		    }
                ));
            }
        }
        return sel;
    }
    function findColumnNumber (label, sheet) {
        for (var i = 0; i < sheet.data.getNumberOfColumns(); i ++) {
            if (sheet.data.getColumnLabel(i) == label) return(i);
        }
        alert ('couldnt find label ' + label);
        // just return the first one
        return 0;
    }
    function doTheViz(control) {

        // create a dataview of the selected columns for scatter plot
        control.xAxisSelected = control.yAxisSelected = -1;

        manageOptionsSubjects(control.options.select.subject.element,control.package.sheets)
            .val(control.options.select.subject.default);
        var chart = new google.visualization.ScatterChart(document.getElementById(control.divName));

        google.visualization.events.addListener(chart, 'ready', function () {
            control.options.selectorElement.css("display","block");
        });
        changeTheView();

        function changeTheView () {
            var select = control.options.select;
            var sheet = findTheData ( control, select.subject.element.val());
            var view = new google.visualization.DataView(sheet.data);

            // because we want to retain the choice from previous sheets
            control.xAxisSelected = control.xAxisSelected == -1 ?
                                        findColumnNumber(select.xAxis.default,sheet) : control.xAxisSelected ;
            control.yAxisSelected = control.yAxisSelected == -1 ?
                                        findColumnNumber(select.yAxis.default,sheet) : control.yAxisSelected ;

            // generate new options
            manageOptions(select.yAxis.element, sheet).val(control.yAxisSelected);
            manageOptions(select.xAxis.element, sheet).val(control.xAxisSelected);

            select.yAxis.element.change(function() {
                updateChartOptions() ;
            });
            select.xAxis.element.change(function() {
                updateChartOptions() ;
            });
            select.subject.element.change(function() {
                changeTheView();
            });

            updateChartOptions();

            function updateChartOptions(){
                control.options.selectorElement.css("display","none");
                // TODO an enhancement to tooltip could be to find the performance data
                // for the instituion in the institution sheet
                control.xAxisSelected = +control.options.select.xAxis.element.val();
                control.yAxisSelected = +control.options.select.yAxis.element.val();
                view.setColumns([control.xAxisSelected,control.yAxisSelected,
                    {sourceColumn:findColumnNumber (control.options.namecolumn, sheet),role:'tooltip'}]);


                var options = {
                    title: control.options.select.subject.element.val(),
                    vAxis: { title : view.getColumnLabel(1) } ,
                    hAxis: { title : view.getColumnLabel(0)  },
                    legend : { position : "none" },
                    animation : { duration : control.options.animationDuration , easing: control.options.animationEasing },
                    height: control.options.height,
                    width: control.options.width
                };
                chart.draw(view,options);
            }
        }
    }
    function findTheData(control,title) {
        var sheets = control.package.sheets;
        for (var i= 0; i < sheets.length; i++) {
            if (title == sheets[i].name) return sheets[i];
        }
        alert ('couldnt find sheet ' + title);
    }


    function initialize () {

        var initPromise = $.Deferred();

        getTheData().done( function (package) {
            var control = {};
            control.package = package;
            control.divName = "chart";

        // set some default options
            control.options = $.extend({
                width : $('#'+control.divName).width(),
                height : 600,
                namecolumn: 'Name of Institution',
                barWidth:$(control.barName).width()/2,
                animationDuration: 1000,
                animationEasing: 'inAndOut',
                selectorElement: $('#'+'selector'),
                select: { yAxis: { element: $('#'+'yaxis'), default: 'Guardian score/100'},
                          xAxis: { element: $('#'+'xaxis'), default: 'Average Entry Tariff'},
                          subject: { element: $('#'+'subject'), default: '1 Med'} }
            }, package.options);

           initPromise.resolve(control);
        })
        .fail( function (error) {
           initPromise.reject(error);
        });

        return initPromise.promise();
    }

    function getTheData() {
        var massage = $.Deferred();
        var package  = {};

        // override any default options here
        package.options = {};
        // all the sheets will end up here
        package.sheets = [];

        getSheetInfo("schema").done( function (info) {
            package.info = info;
            makeLight("sheets","busy");
            var allSheetsPromise = getSheetData(package);
            $.when.apply($,allSheetsPromise)
                .done(function() {
                    // do any data massagin here before resolving
                    package.sheets.sort(function(a,b) {
                        return a.name < b.name ? -1 : (a.name===b.name ? 0 : 1) ;
                    });
                    massage.resolve(package);
                    makeLight("sheets","idle");
                })
                .fail ( function(error) {
                    $('#status').html(error);
                    massage.reject(error);
                    makeLight("sheets","failed");
                });
        });
        return massage.promise();
    }

    function getTheDocsData ( entry , light) {
        var deferred = $.Deferred();
        var h = findVizLinkEntry(entry.link);
        var query = new google.visualization.Query(h);
        // get all columns
        query.setQuery('SELECT * options no_format');
        query.send(function (response) {
            if (response.isError()) {
                deferred.reject('Error in query: ' + response.getMessage() + ' ' + response.getDetailedMessage());
                if (light) makeLight(light,'failed');
            }
            else {
                deferred.resolve(
                    {   entry:entry,
                        data:response.getDataTable(),
                        name: entry.title['$t'].replace(/\d*\s*/,"")
                    });
                if (light) makeLight(light,'idle');
            }
        });
        return deferred.promise();
    }

    function makeLight (what,img) {
        // updates the trafci light status
         d3.select('#'+what+'busy')
            .attr('src', "//xliberation.com/cdn/img/" +img + ".gif");
    }
    function getSheetInfo(light) {
        // note that spreadsheet must be published before you can do this as json
        // this will return the spreadsheet schema info
        var key = "0At2ExLh4POiZdFd0YUhpZVRPUGxFcW85X2xkMm1vY2c";
        var url = "https://spreadsheets.google.com/feeds/worksheets/" + key + "/public/basic?alt=json";
        var proxy;
        return getPromiseData(url,proxy,light);
    }
    function getSheetData(package) {
        // we have the schema, get all the data
        // this will create an array of promises, one for each worksheet
        var entries = package.info.feed.entry, sheetPromises = [];
        for ( var i= 0 ; i < entries.length ;i++) {
            var p =  getTheDocsData(entries[i]);
            sheetPromises.push(p);
            p.done (function (data) {
                package.sheets.push (data);
            });
        }
        return sheetPromises;
    }
    function findVizLinkEntry (links) {
        // there are several versions of the link for each worksheet
        // we'll use the google vizualization one.
        for (var i=0; i < links.length; i++ ) {
            if (links[i].rel.match(/visualizationApi/)) return links[i].href;
        }
        alert ("cant find viz link");
    }
     // general deferred handler for getting json data and creating promise
    function getPromiseData(url,proxyUrl,light){

        var deferred = $.Deferred();
        var u = url;

        if (proxyUrl ) {
                u = proxyUrl+"?url="+encodeURIComponent(url);
        }
        else {
                // if not proxied, needs to be jSONp
                u = u + "&callback=?"
        }

        backOffJson (deferred,u,light);
        return deferred.promise();

    }
    function backOffJson (defer,u, light,tries) {
        // uses exponential back off
        tries = tries || 0;
        if(light)makeLight(light,"busy");
        $.getJSON(u, null,
            function (data, textStatus, jqXHR) {
                if (data.error) {
                    if (data.error.code == 503 || data.error.code == 429) {
                        // a 503 error - so i'll back off
                        tries ++;
                        if (tries <= 5) {
                            // try again
                            var hangAroundFor = (Math.pow(2,tries)*1000) + (Math.round(Math.random() * 1000));
                            if (light)makeLight(light,"lemon");
                            setTimeout(function() {
                                            backOffJson (defer,u,light,tries);
                                        },hangAroundFor);
                        }
                        else {
                            defer.reject(data);
                        }
                    }
                    else {
                      defer.reject(data);
                    }
                }
                else {
                    defer.resolve(data);
                }
        })
        .error(function(res, status, err) {
            defer.reject("error " + err + " for " + u);
        });

        defer.promise()
            .done (function () {
                if (light) makeLight(light,"idle");
            })
            .fail( function () {
                if(light)makeLight(light,"failed");
            });

        return defer;
    }

 })() ;

</script></head>
<body>
    <div style = "height:180px;">
        <div style="width:30%;float:left;">
            <div class="infobar" style="width:100%;float:left">
                <img class="creditimage"
                 src="http://lh3.googleusercontent.com/-MjqAZOIzLvk/AAAAAAAAAAI/AAAAAAAAAAA/HceWILx6kw4/s49-c/photo.jpg"></img>
                <div class="creditintro">
                    <strong>Bruce's comments</strong>
                    <br>This pulls the Guardian UK 2014 University Rankings from Google Docs for basic Google Vizualizations.
                </div>
                <div class="creditbody">Ackowledgements<br>
                    <a href='http://blog.ouseful.info/'>Tony Hirst for the idea</a><br>
                    <a href='http://www.guardian.co.uk/news/datablog/2013/jun/04/university-guide-2014-table-rankings'>The Guardian for the data</a><br>
                    <a href='https://ramblings.mcpher.com'><strong>For more stuff like this visit Excel Liberation</strong></a><br>
                </div>
                <div class="dataprogress">
                    A lemon below means Google is too busy - it retries<br>
                    <strong>getting Guardian Uni Data</strong> <img id="unibusy" class="busy" src="//xliberation.com/cdn/img/idle.gif"></img><br>
                    schema<img id="schemabusy" class="busy" src="//xliberation.com/cdn/img/lemon.gif"></img>
                    sheets<img id="sheetsbusy" class="busy" src="//xliberation.com/cdn/img/lemon.gif"></img>
                </div>

                <div id = "status" class= "status">
                </div>
                <div class="social">
                    <a href="https://twitter.com/share" class="twitter-share-button" data-text="Google Viz University 2014 rankings" data-via="brucemcpherson" data-count="none" data-hashtags="d3js">Tweet</a>
                    <script>!function(d,s,id){var js,fjs=d.getElementsByTagName(s)[0],p=/^http:/.test(d.location)?'http':'https';if(!d.getElementById(id)){js=d.createElement(s);js.id=id;js.src=p+'://platform.twitter.com/widgets.js';fjs.parentNode.insertBefore(js,fjs);}}(document, 'script', 'twitter-wjs');</script>
                    <a href="https://twitter.com/brucemcpherson" class="twitter-follow-button" data-show-count="false" data-show-screen-name="false">Follow @brucemcpherson</a>
                    <script>!function(d,s,id){var js,fjs=d.getElementsByTagName(s)[0],p=/^http:/.test(d.location)?'http':'https';if(!d.getElementById(id)){js=d.createElement(s);js.id=id;js.src=p+'://platform.twitter.com/widgets.js';fjs.parentNode.insertBefore(js,fjs);}}(document, 'script', 'twitter-wjs');</script>

                    <!-- Place this tag where you want the +1 button to render. -->
                    <div class="g-plusone" data-size="small" data-annotation="inline" data-width="200"></div>

                    <!-- Place this tag after the last +1 button tag. -->
                    <script type="text/javascript">
                      (function() {
                        var po = document.createElement('script'); po.type = 'text/javascript'; po.async = true;
                        po.src = 'https://apis.google.com/js/plusone.js';
                        var s = document.getElementsByTagName('script')[0]; s.parentNode.insertBefore(po, s);
                      })();
                    </script>
                </div>
            </div>
        </div>
        <div style="float:right:width:60%;text-align: center;">
            <H1>Guardian 2014 UK University rankings</H1>
        </div>
    </div>
    <br>
    <div id="chart" style="width:100%;">
    </div>
    <div id="selector" style="display:none;">Subject <select id = "subject"></select> yAxis <select id = "yaxis"></select> xAxis <select id = "xaxis"></select></div>
 </body>
</html>
For help and more information join our forum,follow the blog or follow me on Twitter .