Mashing up capabilities
I set myself a little challenge of pulling together a few different things I’ve been working on.
- From a list of queries, get associated tweets, along with their tweet sentiment rating using the Rest-Excel Library
- Create jSon input to d3.js
- Generate a d3.js visualization – in this case a force diagram
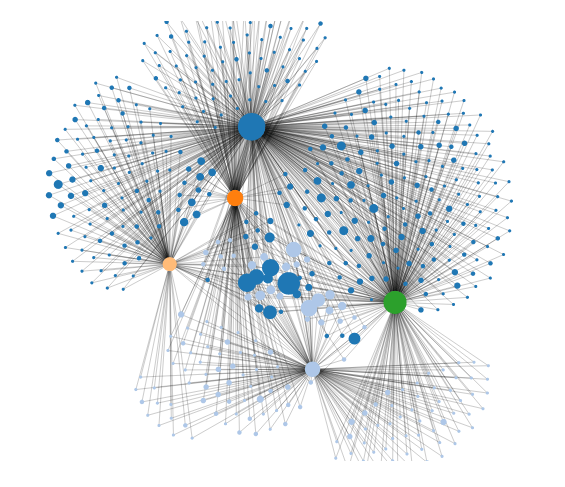
I decided to pull out positive and negative sentiments for Paul, Romney and Obama and visualize the individual word contents of the tweets against the sentiment of each tweet for each one. Here’s the interactive version of the result. To see how its done, straight from Excel, download the cDataSet.xslm workbook from the ramblings site.