What can you learn here?
- array formulas VBA
- using VBA profiler
- using worksheet profiler

Are Array formulas viable with large ranges
On the Excel Blackbelts forum, someone asked a very interesting question about how to analyze relationships between customers and products. I came up with a solution based on VBA, which was used as the basis for the Create a heatmap in Excel article and related blog post. As usual this code is implemented in the arrayFormulas.xlsm workbook downloadable from Download Complete Projects
The problem scenario
The question was how to create a heatmap of associated products, starting from a list of pairs of customer and product number. At first this seemed like a job for some combination of array formulas involving countifs, sumproduct, but the user also said that the input data could be 100000 rows with as many as 30 products. This seemed intuitively too big for an array formula solution, so I pressed ahead with a VBA solution using the Data Manipulation Classes to speed up development.
Why not array formula ?
One of the group members, Peter Bartholomew came up with what I thought was a very elegant solution involving MMULT and COUNTIFS, and it got me wondering whether this could be automated and was it a viable solution to a large data problem. If you just want the answer – then yes, it can easily be automated and no, it’s not a viable solution. It’s not practical to use array formulas on very large datasets like this to solve this kind of problem. Read on for the analysis. However, I believe that if we can find a way to optimize this, a hybrid of VBA automation and formulae is probably the best solution. See Optimizing the array formula, and for a more viable solution see Leveraging sorted data with Match
Generating test data
The first problem was generating enough random valid test data. Here’s how. It’s not great data, since with a sample this size, most cells will end up about even by chance – but the main thing is it gives me volume
Public Sub generateTestMatrixData() Dim r As Range, n As Long, kr As Long, kc As Long, i As Long, j As Long, a() As String Dim id As Long kr = 100000 kc = 30 ReDim a(1 To kc) For i = 1 To kc a(i) = "a" & Format(i, "0#") Next i Set r = Sheets("matrixin").Range("a1") id = 1 i = 0 While i < kr aShuffle a n = Int(kc * Rnd + 1) id = id + 1 For j = 1 To n i = i + 1 If i <= kr Then r.Offset(i).Value = id r.Offset(i, 1).Value = a(j) Else Exit For End If Next j WendEnd SubPrivate Sub aShuffle(p() As String) Dim i As Long, S As String, j As Long Dim x As Long x = UBound(p) - LBound(p) + 1 Randomize For i = LBound(p) To UBound(p) j = Int(x * Rnd + 1) S = p(j) p(j) = p(i) p(i) = S Next iEnd Sub This gives me a 100000 rows that start like this 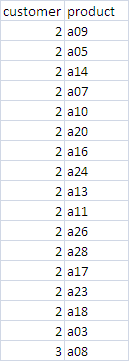
Target solution
In the screenshots following, I’m only looking at the first 10,000 rows for the sake of speed. If you are playing around with this downloaded sheet, I suggest you set calculation to manual. If you run the example it will do that anyway. The objective is to first transform the list into a list of unique customers down the side, with a list of potential products across the top, and a series of 0/1 in the table body that would indicate whether this product was used by this customer, like this 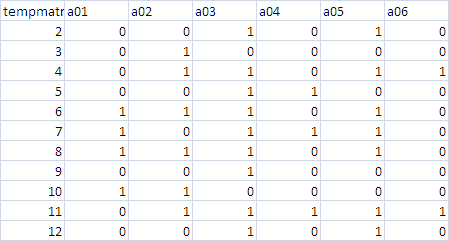 The final array formula to do this is (entered as a CSE array formula) is (thanks Peter)
 =COUNTIFS(MatrixIn!$A$2:$A$10001, tempmatrix!$A$2:$A$662, MatrixIn!$B$2:$B$10001, tempmatrix!$B$1:$AE$1) Next step is do matrix multiplication on this to create a table of product by product, which gives us this 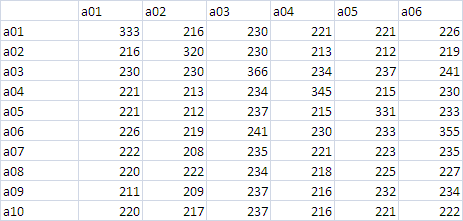 using this formula (and thanks again Peter)
 =MMULT(TRANSPOSE( tempmatrix!$B$2:$AE$662),tempmatrix!$B$2:$AE$662)
Adding heatmap
Next we’ll apply heatmapping ramp formats to that table. 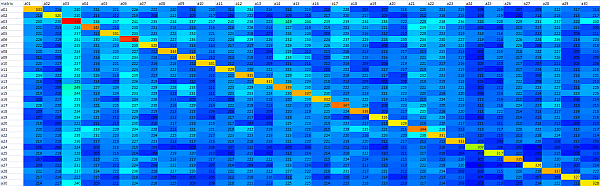 and lets do a couple of heatmap chart as well.
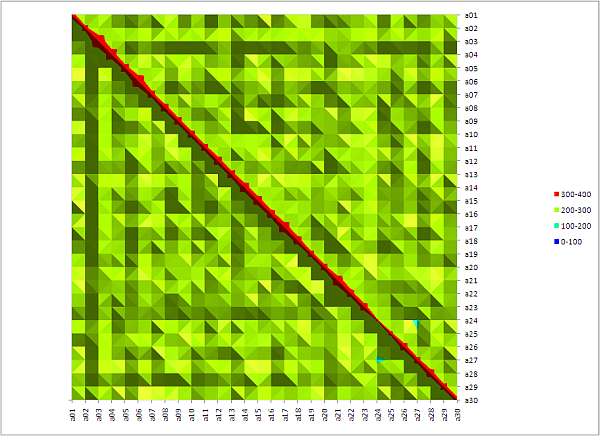
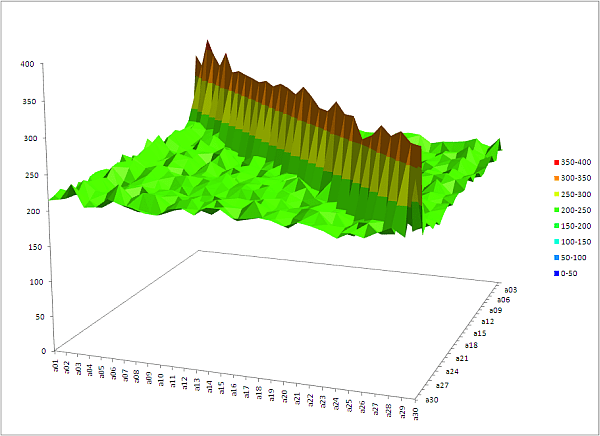 A smaller sample size with more randomness, gives us a nicer chart of course
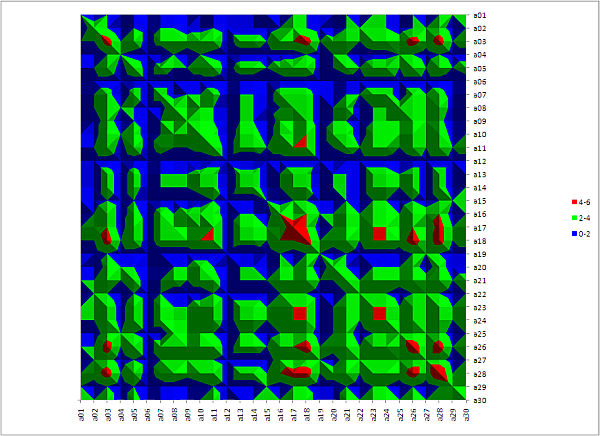
The performance analysis
There are 4 main stages to this process
- Populating – reading and organizing the input data
- Creating formulas to populate the temporary usage table
- Creating formulas for the matrix operation
- Calculating the worksheet.
Using Automatic Profiling tools which you can download on this website I ran various scenarios from 100 to 50,000 rows. Here are the calculation times in seconds. I didn’t even bother with 100,000 and you can see why from the graph below. 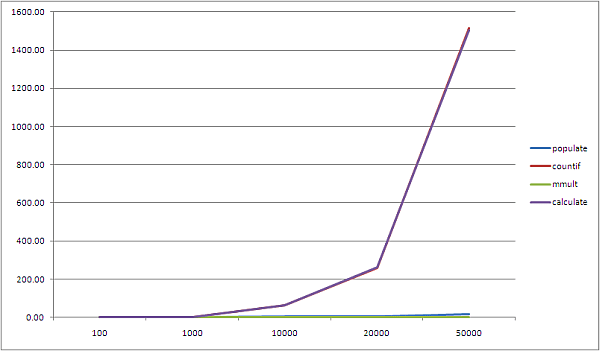

Code
Here is the code to automate all this Sub matrixInExampleX() Dim maxrows As Long maxrows = 100 Dim dsIn As cDataSet, dsout As cDataSet Dim cop As Collection, r As Range, coc As Collection Dim cht As Chart Set dsIn = New cDataSet Set dsout = New cDataSet ' sort it first Application.Calculation = xlCalculationManual Application.ScreenUpdating = Falseworksheets("matrixin").Range("$A:$b").Sort _Key1:=Worksheets("matrixin").Range("A1"), _Key1:=Worksheets("matrixin").Range("b1"), _ Header:=xlYes With dsIn ' create a dset with input data .populateData wholeSheet("matrixin"), , "matrixin", , , , True, , maxrows ' make collections of customers and products that appear Set cop = .Column("product").uniqueValues(eSortAscending) Set coc = .Column("customer").uniqueValues(eSortNone) ' create the output matrixwholeSheet("matrixoutx").Cells.ClearContentswholeSheet("tempmatrix").Cells.ClearContents End With 'get newly created output matrix into a dataset dsout.populateData createMatrixFormulas(coc, cop, dsIn), _ , "matrixout" Set dsIn = Nothing Application.ScreenUpdating = True Application.Calculate ' create heatmap Set cht = createSurfaceChart(dsout, "heatmap") ''''Set cht = createSurfaceChart(dsOut, "heatmaptop", xlSurfaceTopView) Set cht = Nothing Set dsout = Nothing Set dsIn = NothingEnd Sub Private Function createMatrixFormulas(coc As Collection, cop As Collection, _ dsIn As cDataSet) As Range Dim r As Range, wr As Range Dim listcustomer As Range 'MatrixIn'!$A$2:$A$98685 Dim listProduct As Range 'MatrixIn'!$B$2:$B$98685 Dim tableentries As Range 'Sheet2'!$B$2:$J$35 Dim tableHeadingCustomer As Range 'Sheet2'!$A$2:$A$35 Dim tableheadingProduct As Range 'Sheet2'!$B$1:$J$1 Dim matrix As Range Set wr = firstCell(wholeSheet("tempMatrix").Cells) wr.Value = wr.Worksheet.Name Set listProduct = dsIn.Column("product").where Set listcustomer = dsIn.Column("customer").where Set tableHeadingCustomer = _ wr.Offset(1).Resize(coc.Count, 1) Set tableheadingProduct = _ wr.Offset(, 1).Resize(1, cop.Count) Set tableentries = tableHeadingCustomer.Offset(, _ 1).Resize(coc.Count, cop.Count) Set r = tableHeadingCustomer.Resize(1, 1) For Each cc In coc r.Value = cc.Value Set r = r.Offset(1) Next cc Set r = tableheadingProduct.Resize(1, 1) For Each cc In cop r.Value = cc.Value Set r = r.Offset(, 1) Next cc ' the temporary array tableentries.FormulaArray = _ "=COUNTIFS(" & list( _ SAd(listcustomer), _ SAd(tableHeadingCustomer), _ SAd(listProduct), _ SAd(tableheadingProduct)) & ")" ' the final table Set matrix = firstCell(wholeSheet _ ("matrixOutx")).Resize(cop.Count, cop.Count).Offset(1, 1) Set r = firstCell(matrix.Offset(-1)) r.Offset(, -1).Value = "matrix" For Each cc In cop r.Value = cc.Value Set r = r.Offset(, 1) Next cc Set r = firstCell(matrix.Offset(, -1)) For Each cc In cop r.Value = cc.Value Set r = r.Offset(1) Next cc matrix.FormulaArray = _ "=MMULT(TRANSPOSE( " & SAd(tableentries) & ")," & _ SAd(tableentries) & ")" Set createMatrixFormulas = wr.Resize(cop.Count + 1, _ cop.Count + 1)End Function
Conclusion
Whereas you can create a very elegant solution using array formulas, they quickly run out of steam. In the case of this example, the exponential nature of the execution time means you need to consider very carefully the final data set size when implementing. This article referenced a number of other items on this site such as Data Manipulation Classes , Automatic Profiling and Create a heatmap in Excel. You can download everything at Download Complete Projects. See also Optimizing the array formula for how to mitigate some of these problems. This example is contained in the arrayFormulas.xlsm workbook. Why not join our forum, follow the blog or follow me on twitter to ensure you get updates when they are available. You can also submit anything you want considered for publication on this site to our forum.