Today’s post is about how to create a palette to use for a heatmap, and how to apply it to either an Excel Table of values to be compared, or to create surface chart and apply the palette to the categories. A complete description of how this all works, along with the downloadable workbook and code can be found on the Excel Ramblings site.
The heatmap palette
A typical palette for a heatmap would look like this.
The tricky part is to calculate an appropriate RGB combination for the color based on the where the value lies between the min and max value of the other values in the table. The algorithm for this is in the downloadable example.
Using the palette on an Excel table
This example just applies the palette to values in an excel table. Something like this can be done using conditional formatting, but using the heatmap algorithm allows for easy automation in VBA.

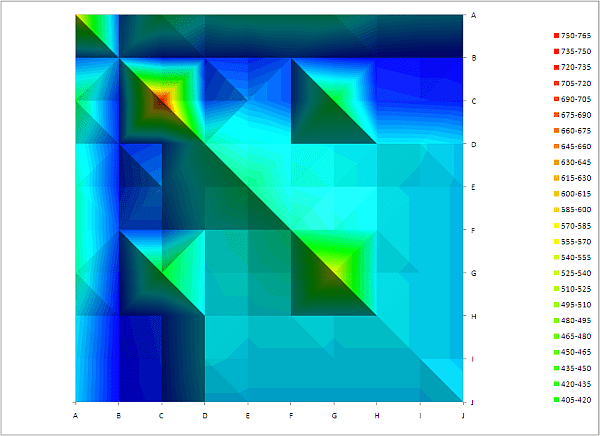
Creating a surface chart to illustrate a heatmap.
Excel provides a nice chart that can be used for very effective heatmap presentation.
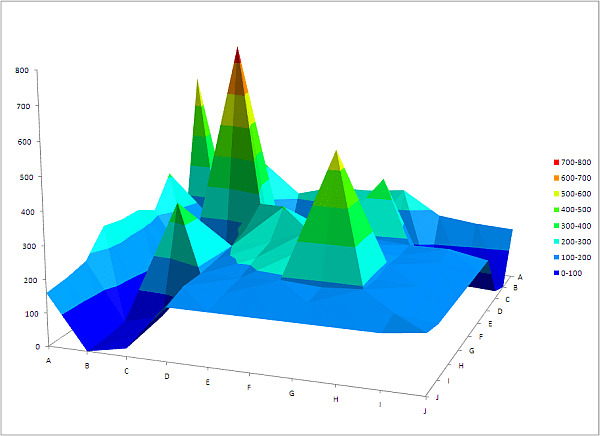
or this variant.
In each case. I have applied the heatmap template to the chart and automated its creation. As usual on this blog, the objective was to provide a capability to do the whole thing in one line of code, as below.
Public Sub heatMapExample()
    Dim dsout As New cDataSet
    createSurfaceChart _
        dsout.populateData(wholeSheet("matrixout"), , "matrixout", True, , , True, "matrix"), _
        "heatmap"
End Sub
For more details, and to download the full example please visit the ramblings site or contact me on our forum.
I have now generalized this to all sorts of color ramps.
see http://excelramblings.blogspot.com/2012/02/color-ramps-and-topographic-maps-in.html