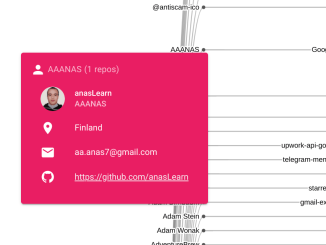
Apps Script
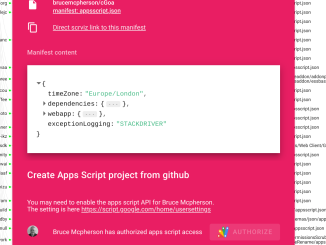
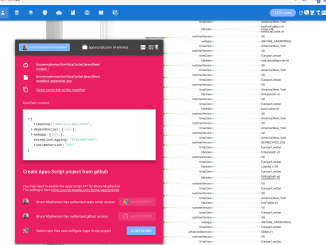
Finding the scriptId from Apps Script projects on github
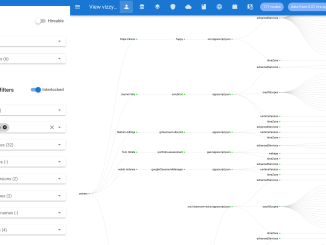
In Every Google Apps Script project on Github visualized I demonstrated an app that could be used to explore what every Apps Script developer who has shared their code is working on. One of the features […]