When we explore a web site, the usual view is that of a tree structure of pages. I wondered if it could be done instead using topics. Which topics are mentioned on a given page? What other topics do those pages refer to and so on?
Node focus force directed diagram
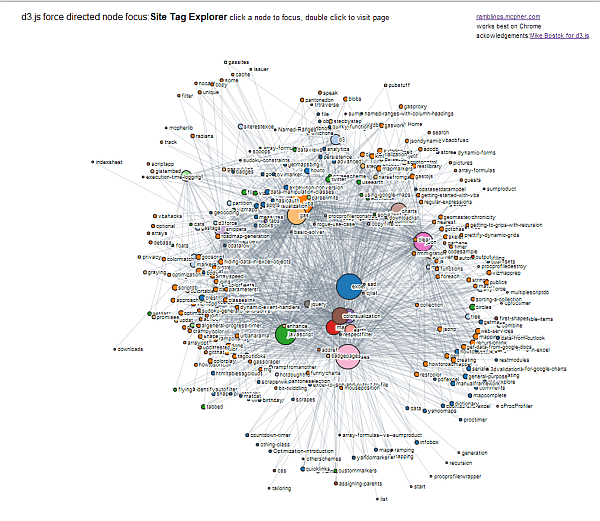
I first thought of using a collapsible force diagram but those need a tree structure – and woul dbe no different that a treeview index. So I went for a modification of that, using d3.js. Here’s a snap of the mapping of the excel liberation site showing the connections between topics and pages.
Focusing in
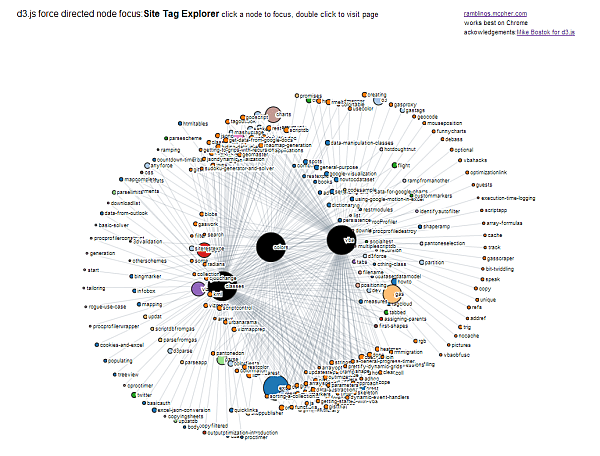
Clicking on a few pages and topics (they are the nodes shown in black below) focuses in like this. Double clicking on any node takes me to the referenced page.
The data
I generate this data using Google Apps Script, from a Google Hosted Site, and store the data on google drive for later retrieval into Google Spreadsheets or Excel. I happen to be using site/tag data but any data that relates topics to subjects is a good candidate for this kind of visualization. Here’s a snap of the input data in Excel
Generating the visualization.
If you don’t have a web site to host data on or don’t have javascript skills to create d3.js code, I do have a number of prebaked d3 visualizations that can be generated straight from Excel. I’ve now added this one. Tweaking a few parameters in an excel table and clicking the button will generate a self contained html file (data, css, javascript, html) that can be run locally – indeed the examples on this page were generated straight out of excel. For more details, the code, and downloadable stuff see Excel Liberation.
Do you need Excel for this?
Live example
For the non- browser challenged, here is the viz of the Excel Liberation site.


