How to add markers to links
In Excel tables to d3.js Force diagram I showed how to create a basic force diagram. Since that time, I’ve added the capability to add markers (arrows) to the end of links to show the direction of flow. At the same time, I also added curvature of the links and shadowing to the labels as I think it improves legibility. Here is the interactive version of the itunes example with curved lines. These ideas came from mike Bostok’s example on patent suits
Example
In this case we are going to take a problem faced by many IT professionals – how to visualize integration between systems. The final result looks like this, and the interactive version is here and below And for the browser challenged still using IE old, here’s a screen shot. 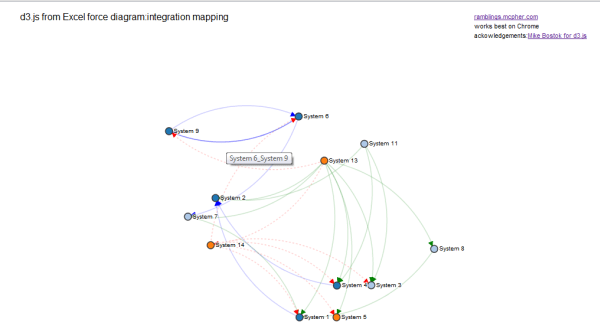 This involved a few more parameters than we’ve so far, so here’s the updated parameter sheet. Now all parameters are consolidated into a single parameter sheet , d3allparameters in the cDataSet.xlsm workbook.
 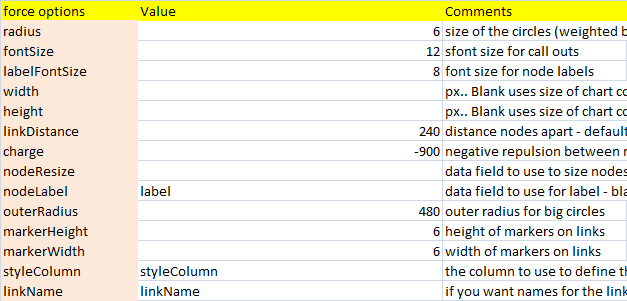 We also have a few extra entries in the Fields parameter block
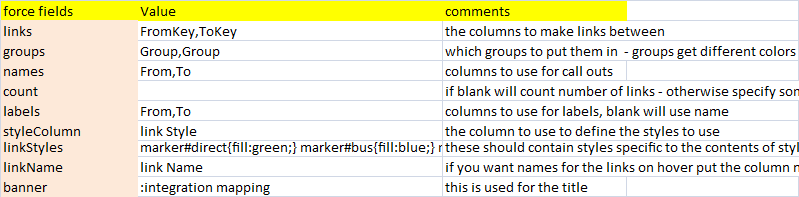
Data
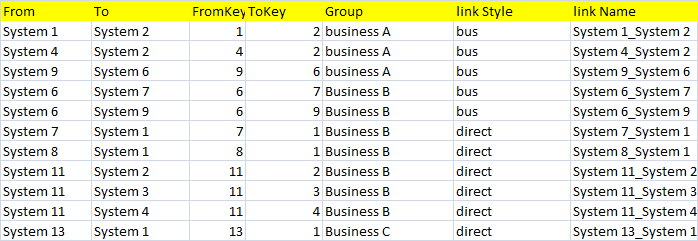
Just as in Excel tables to d3.js Force diagram, any Excel table will do. We’ll use the force fields parameter block to pick out the ones that are to be mapped. Here is the some of the input data for this example.
Parameters
As with many other things on this site, there is a parameter worksheet which contains the code for how to do this. It also contains some user customizable parameters where you can selet the data fields you need, or tweak the diagram format. For more general information on how parameter blocks work, see How to use cDataSet. Many of the parameters have been covered in Excel tables to d3.js Force diagram so I’ll just focus on the new ones
Field parameters
styleColumn
You may want to have different marker and line styles for links. If this is blank then a default style is applied to all links, and there will be no markers. In our example, we are taking the values in the column link Style as different styles. The contents of this column can be whatever you like but you need to later define a style for each unique value.
linkStyles
The unique values I have used in the link Style column ads direct, bus and manual. Each one of these should have a marker and path.link description using CSS syntax. In its simplest form, you will be specifying a stroke and fill color for the links and markers as below. In this case, for example, manual links will show up as red dashed lines with a red end marker, whereas bus links will show up as blue solid lines with a blue marker and so on. This is ignored if there is no styleColumn specified.
marker#direct{fill:green;} marker#bus{fill:blue;} marker#manual{fill:red;} path.link.direct{stroke:green; } path.link.bus{stroke:blue;} path.link.manual{stroke:red;stroke-dasharray: 0, 2 1;}
linkName
When you hover over a link, specifying a linkName column will cause whatever data is in the given column to be displayed.
This is appended to the banner in the options section to form the diagram title
Specifiying the diagram options
I will focus on the new options added since Excel tables to d3.js Force diagram.
markerWidth, markerHeight
Size of the arrow. A blank value here will mean that the links will have no end arrows.
styleColumn
if you want to respect the styles you have defined, as opposed to the default marker style, enter styleColumn here -otherwise leave it blank
linkName
if you want to the contents of the column defined by linkName to show on hovering, enter linkName here, otherwise leave blank
How to change the layout of the generated web page
See Excel tables to d3.js Force diagram
Developer information
If you want to use these modules and classes in your own project, then see Developer information for d3.js force diagrams
Summary
Why not join our forum,follow the blog or follow me on twitter to ensure you get updates when they are available. In the meantime, see what else you can do with d3.js straight from Excel.
Subpages