What are google visualization charts
Google provides a growing number of cool charts that are not available in Excel. For this article we are going to focus on the the Google Motion Visualizations. Please take a look here to become familiar with what they are.
There are a number of ways to create a google chart, some which are;
- Create a web page that contains the calls to the google visualization API, as well as the data to initialize the chart.
- Embed it as a gadget in a googledocs spreadsheet
- Embed as a gadget in a web page, and get the data as a feed from a website, usually from a googledocs spreadsheet
In this article we will look at how to create a web page directly from Excel, and embed it in your excel spreadsheet. The web page created can also be loaded on to a web site. As usual a fully functional workbook with all the code is available in the downloads section.
Using Excel data to populate Google motion charts
Google Motion is one of a family of visualization capabilities available through the Google Visualization API. If you are using googledocs, it is quite straightforward to include in your spreadsheet, just as it is simple to create a webpage with an embedded chart that takes its data from your googledocs spreadsheet.
If you don’t use googledocs though, you either have to convert your data to feed a web page embedded visualization gadget, or you have to write some JavaScript that calls the Google API, and includes the data as part of the code. In this article we will write a complete web page directly from your selected excel data, and display the Google chart embedded in a form in your excel spreadsheet. Since we are creating a temporary html file,. you can of course load that directly on your website or open locally with a browser.
Before we start – a note about Flash
Google uses Flash to display these interactive charts. By default the Flash player is not able to access files that are held locally. Since you will be embedding these charts in your workbook, the .html file will be created locally and will need to be accessed locally . To get round this you need to first follow the instructions on the macromedia website for creating a trusted location for local, flash enabled files. The excel form in the downloadable example gives you the opportunity to define where that is so that all .html files are created there.
What does the generated html code look like
We are going to write a handler in excel that will convert spreadsheet data, that looks like this in our example
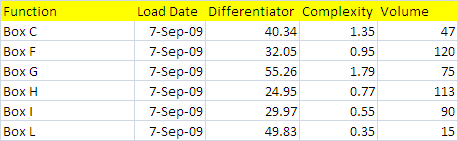
… repeat many times…
….to an html file that looks like this
<html>
<head>
<script type="text/javascript" src="https://www.google.com/jsapi"></script>
<script type="text/javascript">

google.load('visualization', '1', {packages: ['motionchart']});
function funmotion() {
var data = new google.visualization.DataTable();
data.addColumn('string', 'Function');
data.addColumn('date', 'Load Date');
data.addColumn('number', 'Differentiator');
data.addColumn('number', 'Complexity');
data.addColumn('number', 'Volume');

data.addRows(730);
data.setValue(0, 0, 'Box C');
data.setValue(0, 1, new Date(2009,8,7));
data.setValue(0, 2, 40.34);
data.setValue(0, 3, 1.35);
data.setValue(0, 4, 47);
data.setValue(1, 0, 'Box F');
data.setValue(1, 1, new Date(2009,8,7));
data.setValue(1, 2, 32.05);
data.setValue(1, 3, 0.95);
data.setValue(1, 4, 120);

.... repeat many times...
;
data.setValue(729, 0, 'Box S');
data.setValue(729, 1, new Date(2012,11,31));
data.setValue(729, 2, 49.98);
data.setValue(729, 3, 0.85);
data.setValue(729, 4, 151);
var motionchart = new google.visualization.MotionChart(document.getElementById('divmotion'));
motionchart.draw(data, {width: 696, height:480}); }
google.setOnLoadCallback(funmotion);</script></head>
<body>
<div id="divmotion" style="width: 696px; height: 480px;"></div>
</body>
</html>
A note on the requirements for the Google motion chart
At least 3 columns of data are required, the first being what’s called the entity, the second a date, and the third would likely be a number. Subsequent fields would also be numbers and would be available interactively through the chart. The downloadable example does not validate this but a production example probably should, otherwise you could leave it to the chart to complain about the data type if there is a problem.
The downloadable tool
To get you started a downloadable workbook will provide all the necessary code, including a form to control the process and display the finished product. This is the tool in action. You simply select the range where the column headings are and push the make the chart button. If you need to load the result to a web page, the temporary file (googMot.html) can be found in the directory you specify on the form as being trusted to Flash (and for which you have previously followed the instructions on Flash trusted locations above)

How does it work
You will find a number of classes in the workbook that you should just be able to use as is in whatever application you plan to develop, and which I’ll go into later. For the example, the main module is pretty straightforward, and yours should be too.
Public Sub showChart()
    Dim GoogMot As cGoogleChartInput, rHeadings As Range
    'create the chart
    Set GoogMot = New cGoogleChartInput
    If Len(fGoogleChart.RefEdit1.Text) > 0 Then
        Set rHeadings = Range(fGoogleChart.RefEdit1.Text)
        With fGoogleChart.WebBrowser1
            If GoogMot.init(fGoogleChart.tbTrusted.Value & "googmot.html", rHeadings, , _
                        .Width, .Height) Then
                GoogMot.createmotionFile
            ' show the chart

                .Navigate GoogMot.htmlName
                Do
                    DoEvents
                Loop Until .ReadyState = READYSTATE_COMPLETE
            End If
        End With
    Else
        MsgBox ("Please supply a range where the column titles are")

    End If
End Sub
This is called from the form as follows on the appropriate command button click.
Private Sub cbShowChart_Click()
    showChart
End Sub
Whats happening here is
- Instantiation of a cGoogleChartInput custom class
- Identification of the spreadsheet range that contains the column titles (all data up till the first blank line will be plotted)
- Initialization of the cGoogleChartinput class with the appropriate parameters
- Creation of the html file with the .createmotionFile method
- Navigation to the newly created html file using the embedded web-browser object.
The provided classes
There are a number of classes provided, one of which is the topic of this article namely cGoogleChartInput. This makes use of a set of other custom classes, cCell, CDataColumn, cDataRow, cDataSet, cDataSets and cHeadingRow. These are a suite of classes that allow the separation of physical spreadsheet location and data manipulation to be separated and encapsulated, thus simplifying the coding for this and other processes. They are not the subject of this article but you can read about them here.
cGoogleChartInput
This is the class that does all the work. For future articles I will be extending it to deal with other google visualization capabilities, but in this example only the motion chart has been implemented. All the code for this in the example workbook. We will just look at selected methods.
Lets take a look at the .init method of this class. You will notice an optional argument headOrderArray. This is to allow you to vary the order of the columns as supplied by the range rWhere. If you recall, Google has rules about the first 3 columns, so if your data doesn’t happen to be in the right order, this allows you to modify the order, or omit columns, without re-arranging your spreadsheet. A typical argument might be Array(“Function”,”Load Date”,”Volume”). If it is omitted then all the columns in the range will be used in the natural order.
Another item of interest here is that we are reading in the data here, as well as setting up the parameters, using the .getdata method.
Public Function init(fn As String, rWhere As Range, Optional headOrderArray As Variant = Empty, _
                        Optional gwidth As Long = cWidth, Optional gheight = cHeight) As Boolean
    Dim hcell As cCell
    Dim nHeads As Long, s As String
    Set pWhere = rWhere
    pWidth = gwidth
    pHeight = gheight
    phtmlName = fn
    init = False
    nHeads = 0
    s = ""
    If getData Then
        init = True
        ' we got the data ok
        If IsEmpty(headOrderArray) Then
            ' all columns are required
            Set pHeadOrder = pdSet.Headings
        Else
        ' a subset or reordering is required
            Set pHeadOrder = New Collection
            For nHeads = LBound(headOrderArray) To UBound(headOrderArray)
                Set hcell = pdSet.HeadingRow.Exists(CStr(headOrderArray(nHeads)))
                If Not hcell Is Nothing Then
                    pHeadOrder.Add hcell, pdSet.HeadingRow.makekey(hcell.Value)
                Else
                    s = s & headOrderArray(nHeads) & ","
                End If
            Next nHeads
            If Len(s) > 0 Then
                MsgBox "These fields do not exist " & s
                init = False
            End If
        End If

    End If
End Function
The getdata method uses the data manipluation classes mentioned earlier, so collecting the data to be transformed is a simple matter of instantiation of a cDataSet class, followed by a call to its .populateData method.
Private Function getData() As Boolean
    Set pdSet = New cDataSet
    ' just need to provide the range where data headings are
    With pdSet
        .populateData pWhere
        If .Where Is Nothing Then
            MsgBox ("No data to process")
            getData = False
        Else
            getData = True
        End If
    End With
End Function
The only other Public method, aside from .init is .createmotionFile, which actually generates the html and javasscript required to execute the google chart. Again you will see the use of the cDataSet, cCell and cDataRow class to traverse the data previously read by .populateData
Public Sub createmotionFile()
    Dim s As String, hcell As cCell, dcell As cCell, nr As Long, nc As Long, dr As cDataRow
    ' generate html file as input to google chart
    If createHtmlFile Then
        Print #phtmlHandle, htmlPreamble & googleScriptPreamble
        Print #phtmlHandle, motionScriptStart
        ' column headings
        For Each hcell In pHeadOrder
            Print #phtmlHandle, _
                "data.addColumn('" & getColTextforType(hcell) & "', '" & hcell.toString & "');"
        Next hcell
        ' row values
        Print #phtmlHandle, _
            "data.addRows(" & pdSet.Rows.Count & ");"
        nr = 0
        For Each dr In pdSet.Rows
            nc = 0
            For Each hcell In pHeadOrder
                Set dcell = dr.Cell(hcell.Column)
                Print #phtmlHandle, _
                    "data.setValue(" & CStr(nr) & ", " & CStr(nc) & ", " & getTextforType(dcell) & ");"
                nc = nc + 1
            Next hcell
            nr = nr + 1
        Next dr
        Print #phtmlHandle, motionScriptFinish & googleScriptWrapup & motionscriptBody
        Close #phtmlHandle
    End If
End Sub
The only public property available is htmlName, which returns the name of the file that has been generated by .createmotionFile.
Public Property Get htmlName() As String
    htmlName = phtmlName
End Property
Summary and next steps
This kind of technique opens the growing world of google charts and visualizations to excel users who do not want to use googledocs. Watch this space for future articles that serialize Excel data so it can be used as input to embedded google gadgets, as well as further implementations of additional google visualization. You can download the workbook associated with this code and other useful items here. All code is freely available for non commercial use. Please feel free to contact me with suggestions, updates, comments, bug fixes or code enhancements.