There’s a lot of different things going on in this topic. Most of them have been covered before, and lead to this mashup, but I am introducing a new kind of d3 chart (for me anyway) – I’m calling it a force directed node focus chart. It’s kind of a collapsible force directed (as shown by Mike Bostok here), but no quite.
Not quite a tree
The data to be shown is generated by Google Apps Script from a Google Site, as shown in Analyzing site content with GAS. For a collapsible force directed chart, the data would need to be in a tree format – so for example that would work for visualizing a the layout of the pages of a site, but in this case, I’m using data that shows the relationship between topics and the pages they are referenced from – that means that each topic can appear on multiple pages, and of course multiple pages can cover multiple topics. A tree layout would need each page to just have one parent.
Example
Here’s the generated chart – it’s a map of this site. Clicking on a topic or a page node will bring focus to that node and show all the pages or topics that link to it. Clicking on other nodes will add links to those too. Clicking on them again will remove them from focus. Double clicking will go to the page referenced if a page node, or some random page containing the topic if a topic node. When all focus nodes are removed, the whole chart will be shown again.
Mashup
So here’s everything that’s being used. My basic version of this was covered in D3 force from GAS Site
- Analyzing site content with GAS – to create the initial data. You can use any data that lends itself to this kind of treatment. I happen to be analyzing sites and tags.
- Scheduling GAS – to update the source data
- Site data to sheets – to get the data into Excel (or Google Apps Script). This is not strictly necessary of course – I could pick the data directly up from Google Drive or some other place. However this is to abstract the data creation from its use.
- d3.js – d3 of course, to generate the chart
- Excel tables to d3.js Force diagram – I already have the capability to generate complete d3 web pages directly from Excel. I’ve added a new d3 chart type for this. The self contained (data, styles, javascript, html) file is generated locally so you don’t even really need a web server to host your files.
What’s needed
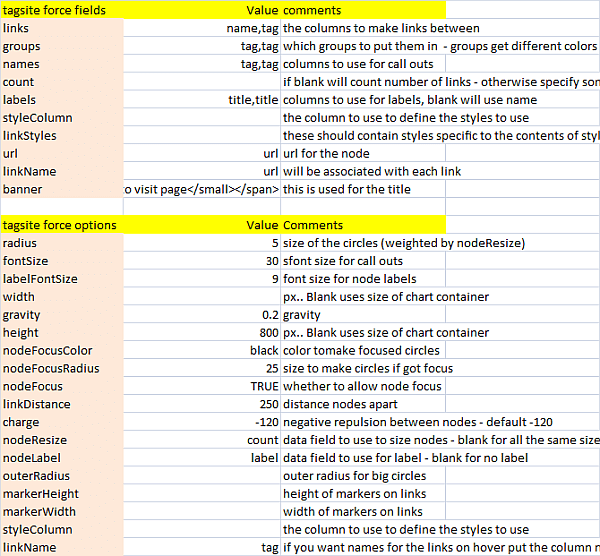
Some parameters
You can find them in the d3AllParameters of cDataSet.xlsm. These can be used to control the data and the layout of the generated d3.js
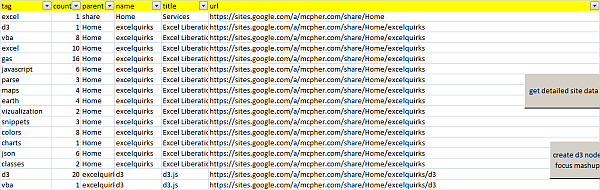
Some data
As generated by Site data to sheets. The column headings are referenced in the first set of parameters above. This data can be any suitably formatted dataset. Here’s a snap
Hit the button and you get
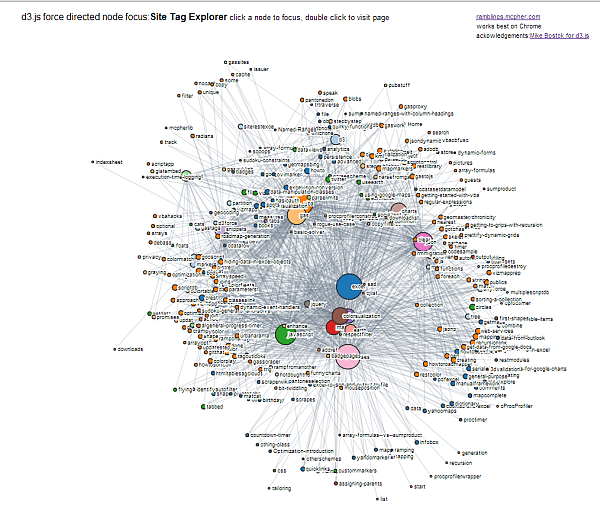
Click on a couple of nodes and you get
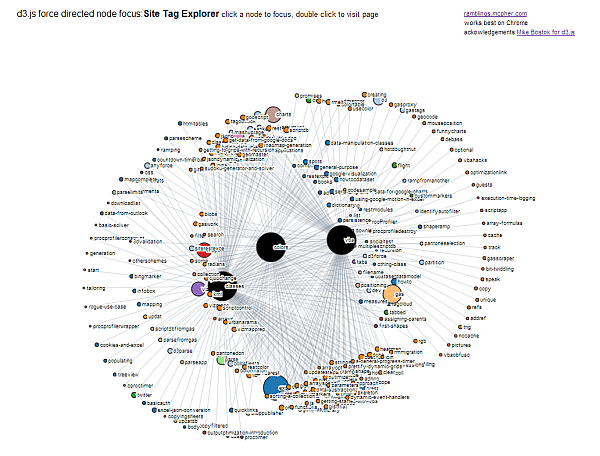
Here’s the generated thing to play around with.
Continue exploring GAS and sites