In Using Google Maps I covered how to create various web based interactive maps. Of course many would like to use Excel to create maps, and the topic of chorpleth maps, has been covered many times by many others. Indeed, I would like to credit the clearly and simply blog for the map i’ve included in the example downloadable in cDatSet.xlsm
One liner
To put a different spin on it, I’m going to show you how to create a one liner to plot data on a thematic map, using cDataSet and Color ramp library. Here’s the output  The data is just the world population, using a slow color ramp, and a fragment of the input data looks like this.
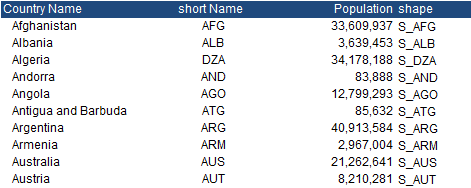
The code
Well .. it’s a one liner
Public Sub makeWorldMap()
    Dim ds As New cDataSet
    ds _
        .populateData(wholeSheet("countryList"), , , , , , True) _
        .shapeRamp "World Map", "population", "shape", "country name", "S_unknown", , "slowRamp", , False
End Sub
Walkthrough
- We’ve seen .populateData many times in How to use cDataSet and elsewhere. This is just populating a dataset with the input data, found in the countryList Tab. Note that the the respect filter parameter is true, meaning that we can base the dataset on any operating autoFilters – see Make a copy of a sheet and respect autofilter for details.
- .shapeRamp() is a new cDataSet method, that will take its data and apply it to a group of shapes. In this case, a map. The map itself is simply a set of excel shapes where the name of each shape corresponds to a shape name in the data. Here is the call stack. Most of the arguments are optional and take some operational defaults
Public Function shapeRamp(wNameWhereShapesAre As String, _
                            Optional dataColumnName As String = "data", _
                            Optional shapeColumnName As String = "shapes", _
                            Optional screenTipColumnName As String = vbNullString, _
                            Optional unknownShapeName As String = vbNullString, _
                            Optional unusedShapeColor As Long = 7897995, _
                            Optional rampName As String = "heatmap", _
                            Optional showValueAsTip As Boolean = True, _
                            Optional complain As Boolean = True, _
                            Optional unusedShapeColorApply As Boolean = False) As cDataSet
Let’s look at that versus the arguments given in our example
.shapeRamp “World Map”, “population”, “shape”, “country name”, “S_unknown”, , “slowRamp”, , False ,True
- “World Map” is where the shapes are
- “population” is the column name in the data set to find the data
- “shape” is the column name in the data set to find the corresponding shape names
- “country name” is the column name in the data set to find labels to apply to tooltips when hovering over the countries (note that this does not work 100% – tooltips don’t really exist with shapes so it’s a bit of a hack that doesn’t work properly when shapes are grouped (as in this example) ).
- “S_unknown” is a shape into which to accumulate the data if the shape name given in the data cannot be found in the shapes in the map. There are a few unknowns in this map, which does not quite contain all countries for which there is data. Note that duplicate shape names are allowed in the data and are added together. This means that the data can be either raw, or summarized.
- unusedShapeColor is the default value. This is used to color any shapes which exist in the sheet but are not referenced in the data.
- “slowRamp” is the name of the Color ramp library entry that we are going to apply. You can create your own or use some of the existing ones.
- showValueAsTip takes the default value and therefore will add the actual value to the tooltip text as you hover over a country.
- complain is set to false, since we dont want to complain if there is any data with missing shapes – we’ll just accumulate them in the unknown shape.
- unusedShapeColorApply is set to true, which means to color any shapes not referenced in the data with the color selected in the unusedShapeColor parameter.
Using other shapes
Since the map is just a series of named shapes, it doesnt have to be a map. It can be any shapes that you want to color based on the the data in the cDataSet. In this case I named a few of the shapes that make up this santa picture as below, and applied a standard heatmap color ramp using the values shown.
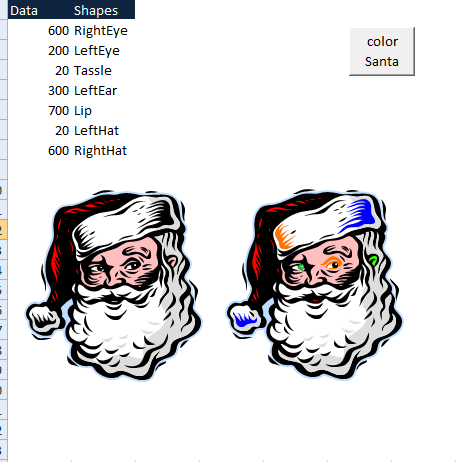
Again it’s a one liner
Public Sub makeSanta()
    Dim ds As New cDataSet
    ds _
        .populateData(wholeSheet("santa"), , , , , , True) _
        .shapeRamp "santa"
End Sub
Summary
Take a look at One Liners for more tips like this. In the meantime why not join our forum, follow the blog or follow me on twitter to ensure you get updates when they are available. You can this example in the cDataSet.xlsm from Downloads. Thanks again to the clearly and simply blog for the idea.