Going back to the theme of ‘doing complicated things in one line of code’, here’s a mash up of cDataSet, Color Ramps, Mapping and various other things.
Lets say we want to create a thematic map in Excel from a simple set of data, in this example, the population of each country in the world, and apply a heatmap coloring. (I would like to credit the clearly and simply blog for the map and idea)
Here’s the result
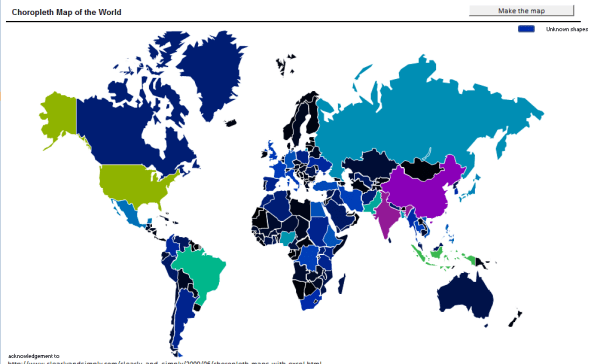
and here’s the code
Public Sub makeWorldMap()
    Dim ds As New cDataSet
    ds _
        .populateData(wholeSheet("countryList"), , , , , , True) _
        .shapeRamp "World Map", "population", "shape", "country name", "S_unknown", , "slowRamp", , False, True
End Sub
Now since this map is just a bunch of named shapes, we can apply the same principle to any set of shapes. Here’s a Santa with bits of his face heatmapped according to the data shown.
and here’s the code
Public Sub makeSanta()
    Dim ds As New cDataSet
    ds _
        .populateData(wholeSheet("santa"), , , , , , True) _
        .shapeRamp "santa"
End Sub
For more stuff like this and to download this example, see the ramblings site