How to put markers on maps
This is part of the Step by Step Guides to get started with some of the more complex topics on this site. The full story on vizMap can be found at Data Driven Mapping Applications
What you need
GoogleMapping.xlsm from the Download Complete Projects page
Objective
To be able to prepare your data so you can create an application that uses Google Earth or Google Maps, and embeds Google data visualization and twitter activity of your data straight out of Excel.
Steps
These kind of applications can be quite complex to set up. Generally speaking there are multiple transactions associated with each spot on the map. This is because you want to visualize (using charts and/or tables inside a pop up infoWindow) quantifiable data associated with a particular location. That means that we may have to handle data matching and joining as well as mapping. The step by step example is an application which takes concert venues as the locations, with concerts as the transactions, and a look up of artist details to combine into a single dataset to be mapped and visualized. There are plenty of other examples to be found in Data Driven Mapping applications
Joining Data
- It is expected that you have at transactional data, locational data which has already been geocoded (probably using How to Geocode addresses using Google Maps) and perhaps other lookup type data, all of which needs to be combined and plotted on either Google Earth or Google Maps. You can do that using the built in joining capability or some other method of your own devising.
- Go to the Step by Step Transactions Sheet. This contains the list of concerts (Transactions) and looks like this. The next task is combine this with the locations – by matching on Address ID, and artists, by Matching on Artist ID.

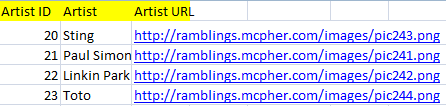
- Go to the Artist Master Sheet. Here is a list of artists corresponding to the Artist ID in the transactions. The idea is that we will combine the artist information with the transaction data.
- Go to the Step by Step Master Sheet. Here is the list of locations we already used in How to Geocode addresses using Google Maps and How to put markers on maps. Now we are going to join that to the transaction data using the address ID.
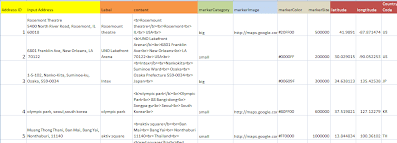
- Go to the Step by Step Join sheet. Here you will see the result of joining all this data. This is the data that is going to be used to create a VizMap application. If you already have such data, perhaps joined from a database, you of course can just start here – ignoring the previous steps. Here is the joined data
![]()
What just happened ?
Your data is now organized so you can create a vizMap Data Driven Mapping applications
What Next
Read more about the detail of how all this works and walk through the source code at Vba to join master and transactional data see some more Step by Step Guides (see below).
In the meantime why not join our forum, follow the blog or follow me on twitter to ensure you get updates when they are available.
- How to add flightPaths on a Map
- How to add quickLinks to a Map
- How to control your vizMap application
- How to define your vizMap application – Dictionary
- How to define your vizMap Application – visualizations
- How to filter markers by Category
- How to Geocode addresses using Google Maps
- How to modify geocoding and mapping parameters
- How to Overlay circles on a Map
- How to prepare for your VizMap application – Parameters
- How to put markers on maps
- How to use alternate Map icons