This is part of the Step by Step Guides to get started with some of the more complex topics on this site. The full story on marker quicklinks can be found at Overlaying circles and heatmaps
What you need
GoogleMapping.xlsm from the Download Complete Projects page
Objective
To be able to overlay circles of different sizes and colors on top of a map created according to How to put markers on maps
Steps
All Mapping activities, are controlled by 2 parameter sheets. One is general, and tells the procedures how to deal with the data returned from the various mapping providers (geoCodingParameters worksheet) and the other is specific to particular sets of data or desired results (in this case ‘step by step parameters’)
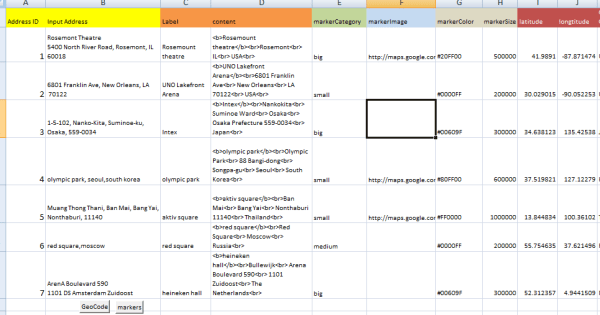
- Go to the step by Step MasterTab. This is where you enter the data to be placed on a map . You’ll find some example data that looks like this. The columns in Yellow were already completed in How to Geocode addresses using Google Maps, the latitude and longitude would already have been calculated, and the orange columns were already completed in How to put markers on maps. The green column was completed in How to filter markers by Category and the blue column was completed in How to use alternative Map icons. Now you need to provide data in the gray columns. Here you will be providing circle color and size. These circles will be overlayed on the appropriate markers. The color can be any html hex code, but in the case I am using a heatmap approach where the intensity is based on the size. See the size of circles on Google Maps for advice on calculating this. To do this I can use the functions covered in Color ramp library to calculate an appropriate color. The formula in column G is
=rgbToHTMLHex(rampLibraryRGB("heatmap",MIN($H$2:$H$8),MAX($H$2:$H$8),H2))
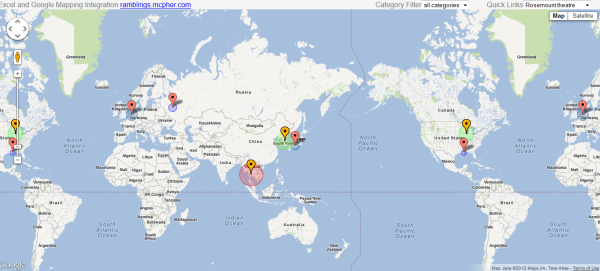
- Hit the markers button and the plotted map will have different colored and sized overlaid circles as follows.
- No more steps. That’s all there is to it.
What just happened ?
javaScript code to create these icons was generated as part of the How to put markers on maps process. If you do not want this to be displayed you can amend the web page template according to the instructions at Overlaying circles and heatmaps or simply do not include a markerSize or markerColor column in the data, or set the size to 0 for any markers you don’t want circles for. As with all data items, the name of the column in which to find the icons is tailorable in the parameters sheet.
What Next
Read more about the detail of how all this works and walk through the source code at Mapping and adding markers to maps or see some more Step by Step Guides (see below for more topics). In the meantime why not join our forum, follow the blog or follow me on twitter to ensure you get updates when they are available.
- How to add flightPaths on a Map
- How to add quickLinks to a Map
- How to control your vizMap application
- How to define your vizMap application – Dictionary
- How to define your vizMap Application – visualizations
- How to filter markers by Category
- How to Geocode addresses using Google Maps
- How to modify geocoding and mapping parameters
- How to prepare for your vizMap application – Data
- How to prepare for your VizMap application – Parameters
- How to put markers on maps
- How to use alternate Map icons