This is part of the Step by Step Guides to get started with some of the more complex topics on this site. The full story on vizMap applications can be found at Data Driven Mapping applications
What you need
GoogleMapping.xlsm from the Download Complete Projects page
Objective
To define the visualizations to show inside infoWindows in Google Maps or Google Earth in vizMap Data Driven Mapping applications.
Steps
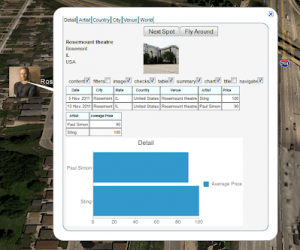
In How to define your vizMap application – Dictionary we covered defining fields that can be referenced in a vizMap application. Now its time to use them. Go to the step by step join sheet and launch the visualization button. This will fire off a Google Earth or Google Maps session that will look something like this, when you click on one of the markers. Note that the infoWindow has Tabs, and each tab will show a different view of your transactional data. For more detail on tabs see VizMap Tabs
Setting up tabs
- Look at the parameter block named Tabs in the step by step parameters sheet. Each row corresponds to a tab in the infowindow above, and each column describes a visualization type that can be included in each tab. The number of rows define the number of tabs that will be shown in an infowindow. You can add as many or as few as you want. The body of the table describes your dictionary items that will be used to populate these visualization types. For more detail on this see VizMap Tabs, VizMap Measures, and for how to position each visualization relative to each other in the infoWindow see VizMap Element positioning.
![]()
Measures are used to summarize your data for charting. Look at the measures parameter block. You’ll see that some of the dictionary items that used the same input column are shown here with different summary treatment.
![]()
What just happened ?
The Tabs parameter block describes the contents of each infowindow. If you don’t need tabs, then you probably don’t need a vizMap application. Instead try How to put markers on maps – its much easier to set up since there is not the concept of transactions and master data.
What Next
Read more about the detail of how all this works and walk through the source code at VizMap Tabs, Creating a tabbed Google Mapping InfoWindow, VizMap Element positioning, VizMap javaScript, Using Google Visualization charts and tables and Using Twitter in Earth and Maps or see some more Step by Step Guides topics (see below).
In the meantime why not join our forum, follow the blog or follow me on twitter to ensure you get updates when they are available.
- How to add flightPaths on a Map
- How to add quickLinks to a Map
- How to control your vizMap application
- How to define your vizMap application – Dictionary
- How to filter markers by Category
- How to Geocode addresses using Google Maps
- How to modify geocoding and mapping parameters
- How to Overlay circles on a Map
- How to prepare for your vizMap application – Data
- How to prepare for your VizMap application – Parameters
- How to put markers on maps
- How to use alternate Map icons