We had a question on our forum the other day about whether it would be possible to inherit the cell colors from the color of the originating cells in Excel in the d3.js Sankey diagram created directly from Excel data.
The answer is of course, yes. As usual the parameter sheet controls the options.
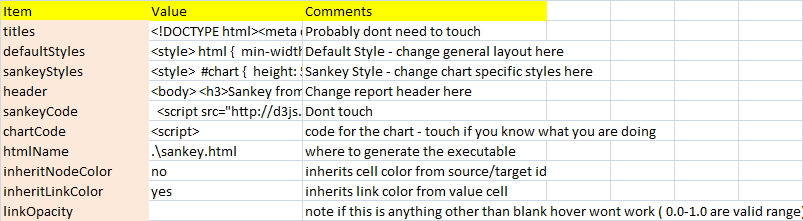
The new options are
- InheritNodeColor – if yes, the the color of the nodes will match the background color of the cells of the source or targetIDs as appropriate.
- InheritLinkColor – if yes, the color of the link will match the background color of the value that gives it its width
- linkOpacity. This has a default value of .2, and as you hover over a link it darkens. If you specify any value in here, the hover feature will not work (its a long story). Setting it to 1 will cause the inheritLinkColor to be fully saturated. Any value between 0 and 1 will progressively darken the color.
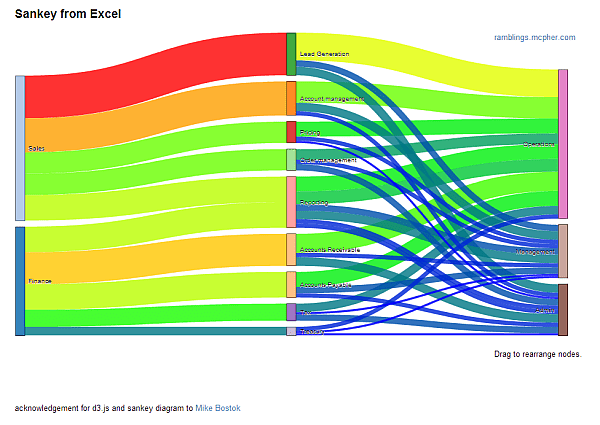
Here’s an example of a chart with fully saturated links (linkOpacity 1)
and for the browser challenged, a picture of it
Here’s the input data that created this. I applied a heatmap to the data to get the coloring
See more stuff like this and download the code for this in the cDataSet.xlsm workbook on the Excel Liberation site.