First of all thanks to Tony Hirst for blogging about this in the first place to put me on the track, and of course to Mike Bostok who created d3.js
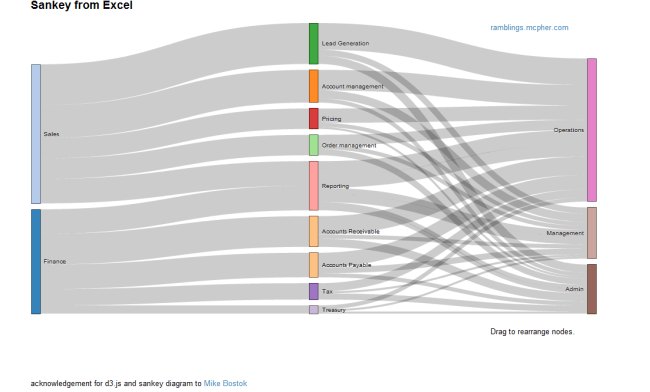
I figured it should not be too hard to create the capability in Excel to generate Sankey diagrams directly from Excel tables. Here is the result, with a screenshot below (note:doesn’t work on IE8 and below). You can read about how this is done, and download the code at the ramblings site
I am a Google Developer Expert and decided to investigate Google Apps Script in my spare time.
The more I investigated the more content I created so this site is extremely rich. Now, in 2019, a lot of things have disappeared or don’t work anymore due to Google having retired some stuff. I am however leaving things as is and where I came across some deprecated stuff, I have indicated it.
I decided to write a book about it and to also create videos to teach developers who want to learn Google Apps Script. If you find the material contained in this site useful, you can support me by buying my books and or videos.
bruce mcpherson is licensed under a Creative Commons Attribution-ShareAlike 4.0 International License. Based on a work at http://www.mcpher.com. Permissions beyond the scope of this license may be available at code use guidelines