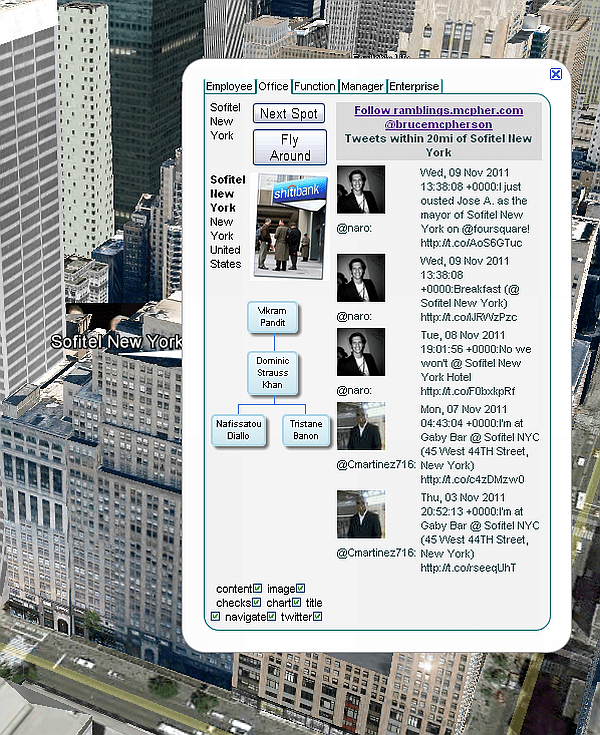
Twitter, Google Visualizations, Google Maps, Google Earth, Excel – all together.
In various posts such as Flying around with Google Earth and The Royal Family and their homes as well as on the ramblings site I showed how to create data driven applications right out of Excel that leveraged visualizations, Google Earth and Google Maps.
The latest version of this, which can be downloaded from the ramblings site , now has Organization charts, and relevant tweets as options for displaying in infowindows or infobubbles. As before, if you prefer, these can be added without writing any javaScript, and generated straight out of Excel.
Here is an example application that I generated today – all about bankers. (deprecated)

