Color Ramps
In a previous post, I showed how to automate the\ creation of a heatmap in Excel. It occurred to me that this could be generalized to any color ramp. Here is an extensible color ramp library you can download and incorporate in your VBA/Excel procedures.
That allows us to plot something like this for some function (x,y)
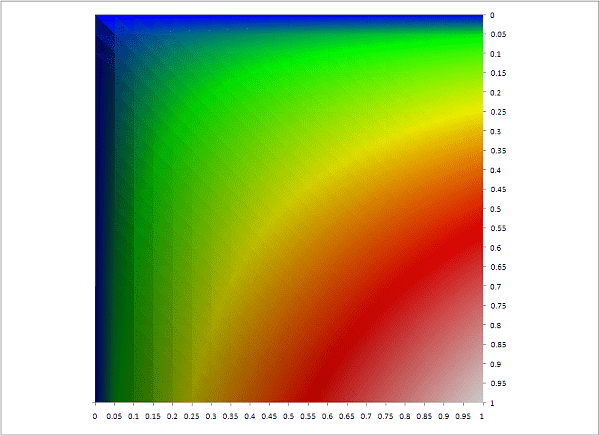
and here is all that’s needed
Public Sub colorRampVisualize()
    Dim dsout As New cDataSet
    createSurfaceChart _
        dsout.populateData(wholeSheet("crampviz"), , "crampviz", True, , , True, "y/x"), _
        "crampChart", xlSurfaceTopView, 200, "heatmaptowhite", False
End Sub
Topographic maps
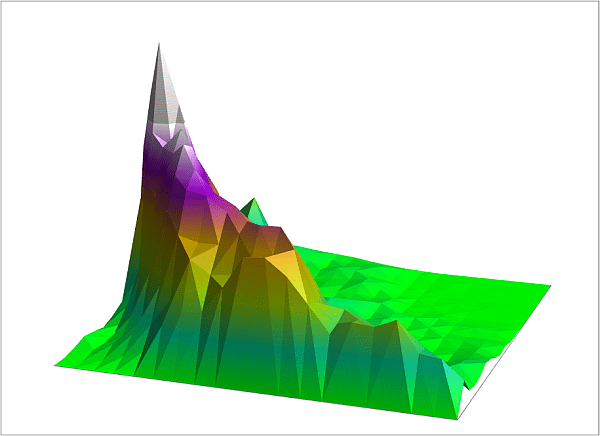
Taking that a stage further, and automating the production of charts that use this library, you can start to create topographic maps, given a table of co-ordinates against elevations.
Here is an example, using randomly generated elevations for an imaginary landscape.
and here is code
Public Sub colorRampElevation()
    Dim dsout As New cDataSet
    'redo the random elevations
    Application.Calculate
    createSurfaceChart _
        dsout.populateData(wholeSheet("elevate"), , "elevate", True, , , True, "lat/lon"), _
        "top", , 200, "terrainnosea", False, , False

End Sub
Take a look on the ramblings web site to download these libraries and to see how this is done.