Deprecated
Google has now stopped its Earth API and Maps API is a paid for API nowadays. Some capabilities have also been either removed or changed. Therefore, I had to remove all examples of VizMap applications I had created. I didn’t remove the entire topic as I thought some of the code may still be useful with some modifications.
javaScript: creating google visualization Data Views
This relates to Data Driven Mapping applications and the Javascript ‘HowTo’ section
Google Visualization dataViews
As mentioned in Using Google Visualization DataTables a master google DataTable is created for all data in the VizMap Dictionary and this table is subsequently filtered for use in each of the VizMap Tabs. This filtering is done once only, and the visibility of them is changed when selected or unselected through CSS.
Creating these dataViews makes this whole process rather simple. Here is how each dataView is generated using the Creating VizMap framework to drive which fields are included and filtered on. Some of the utility functions referenced here are introduced in Using Google Visualization DataTables
mcpherInfoTab.prototype.viewTable = function (vType,needGroup) {
 var mm = this.parent.parent;
 var tItems = mm.cTabs[ mm.tabs[this.tabIndex] ][vType];
 var colIndex;

 if (!tItems) {
   alert ('Cant find ' + vType + 'fields for ' +
                    mm.tabs[this.tabIndex]);
   return (null); }
 else {
 // only include data columns referenced in tab[].table
   var viewColumns = new Array();
   for ( var i=0 ; i < tItems.length ; i++ ){
     if ( (colIndex = mm.columnIndex(mm.mTable,tItems[i])) >= 0)
       viewColumns.push (colIndex);
     else
       alert (tItems[i] + ' is required for ' + vType + ' in tab '
                           + mm.tabs[this.tabIndex] +
                           ' but was not found in the dictionary');
     }
     var gTable = new google.visualization.DataView(mm.mTable);
     //now filter rows
     var fItems = mm.cTabs[ mm.tabs[this.tabIndex] ]['filter'];

     if(fItems) {
       this.filters = new Array();
       for (var i=0; i < fItems.length ; i++){
         if ( (colIndex = mm.columnIndex(mm.mTable,fItems[i])) >= 0)
             this.filters.push ({'column' : colIndex,
                               'value' :
           mm.columnValue(fItems[i],this.parent.cJobject[fItems[i]]) } );
         else
           alert (fItems[i] + ' is required filter for '
                  + vType + ' in tab ' + mm.tabs[this.tabIndex] +
                   ' but was not found in the dictionary');
        }
        gTable.setRows (gTable.getFilteredRows(this.filters));
      }
      if (!viewColumns.length) {
             alert ('there were no columns required for ' +
                     vType + ' in tab '
                     + mm.tabs[this.tabIndex] );
             return(null);
      }
      if (needGroup) {
          var grouping = new Array();
          var aggregate = new Array();
          for (var i=0; i < viewColumns.length ;i++ ) {
             var lab;
              if (mm.isMeasure(lab=gTable.getColumnLabel(viewColumns[i])))
                 aggregate.push ( {'column': viewColumns[i],
                               'aggregation' :
                                   mcpherGag(mm.cMeasures[lab]),
                               'type' : 'number'} );
                  else
                      grouping.push (viewColumns[i]);
                 }

           return( google.visualization.data.group
                         (gTable, grouping, aggregate )) ;
       }
       else {
         gTable.setColumns(viewColumns);
         return (gTable) ;
       }
    }
  };
this function would be called for each of the tables required in each tab
mcpherInfoTab.prototype.createTable = function () {
         return (this.viewTable ('table', false));
   };
mcpherInfoTab.prototype.chartTable = function () {
         return (this.viewTable ('chart',true));
   };
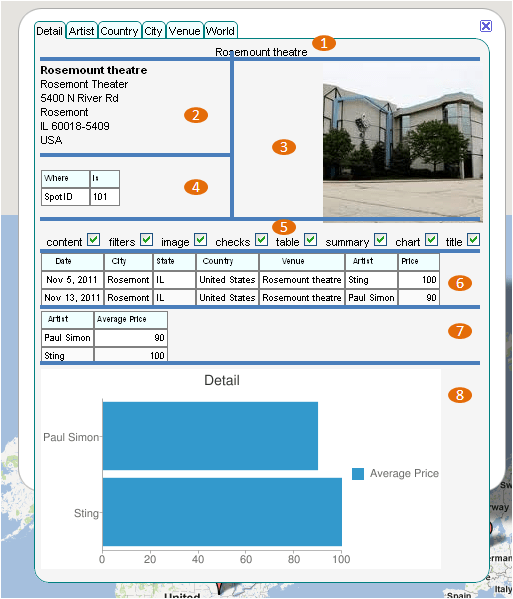
The visualization of all this is below – items 4, 5,6,7 and 8 are all dataViews being shown within a tabbed info window – item 7 and 8 are grouped, the others are not. Each tab has its own version of the data view depending on the filter fields defined in 4. These dataViews are all generated from the master data table referenced in Using Google Visualization DataTables