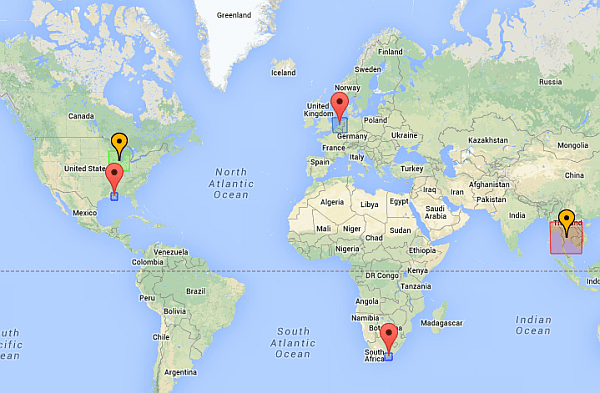
Overlaying shapes on markers
Try it out first ?
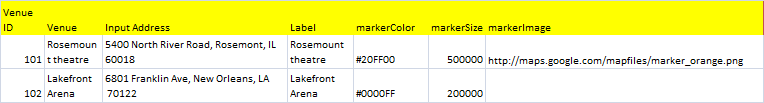
How to specify circle sizes and colors

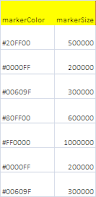
Specifying the color
The color is specified as standard html color code. This is similar, but not the same as, RGB codes. See VBA rgb to htmlRGB for how to convert. Quite often using a color ramp – see Charts and color ramps, is an effective method of choosing overlay colors. You can use the Color ramp library to do this, and it can be entered as an Excel formula. In the example above, the markerColor column has this formula – with the color being calculated according to its position relative to the maximum and minimum size.
=rgbToHTMLHex(rampLibraryRGB("heatmap",MIN($F$2:$F$8),MAX($F$2:$F$8),F2))
Activating circles
Changing the properties of the circle
if (sz) {
      var circle =  {
         strokeColor: color,
         strokeOpacity: 0.8,
         strokeWeight: 1,
         fillColor: color,
         fillOpacity: 0.20,
         map: gMap,
         center: p,
         radius: pa
Changing these is just a matter of editing the above, which is in the functions row of the marker html parameter block in the geoCodingParamers worksheet. For advice on calculating sizes, see the size of circles on Google Maps.
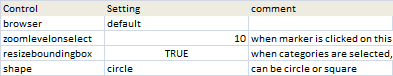
Using squares instead of circle overlays
Using alternative Markers
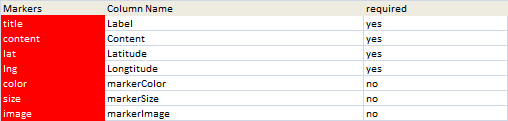
You can also specify alternative markers. In the same Markers parameter block, just specify an alterative image to use in the column that corresponds to the markerImage parameter.
See Creating a VizMap Application for how to do the same thing with more complex applications in both google maps and google earth.