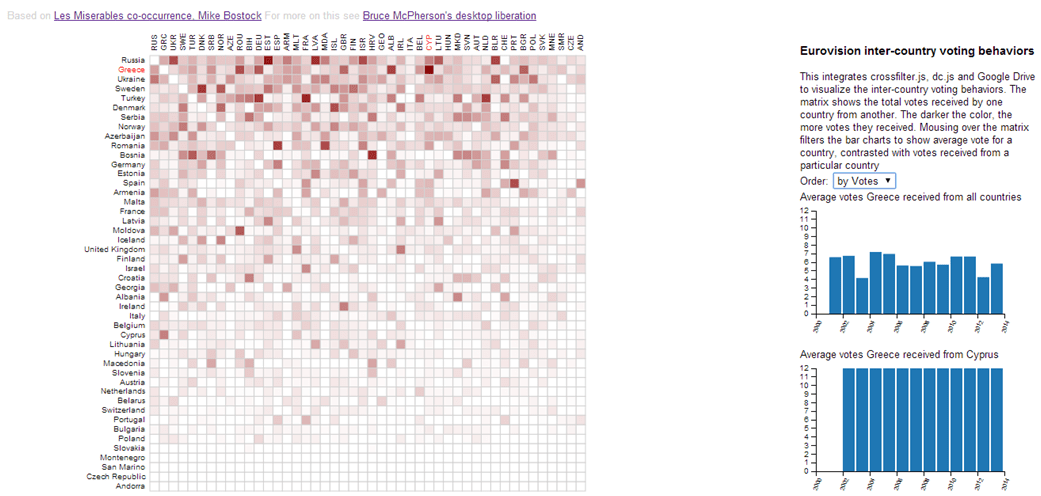
I couldn’t let a Eurovision weekend pass without doing some kind of visualization. I’ve always been fascinated by how the relationship between countries is manifested through the way that they vote for each other, regardless of the (relative) quality of the song. This darker the mark on this visualization, the more a country votes for the other. Hover over the intersection and you’ll see how much votes they gave each year, compared to the votes given by other countries.
I am a Google Developer Expert and decided to investigate Google Apps Script in my spare time.
The more I investigated the more content I created so this site is extremely rich. Now, in 2019, a lot of things have disappeared or don’t work anymore due to Google having retired some stuff. I am however leaving things as is and where I came across some deprecated stuff, I have indicated it.
I decided to write a book about it and to also create videos to teach developers who want to learn Google Apps Script. If you find the material contained in this site useful, you can support me by buying my books and or videos.
bruce mcpherson is licensed under a Creative Commons Attribution-ShareAlike 4.0 International License. Based on a work at http://www.mcpher.com. Permissions beyond the scope of this license may be available at code use guidelines