A few months ago, I posted something about instrumenting desktop apps with Google Universal Analytics to track usage, just like you can with web based analytics. In the meantime, I’ve added analytics to the 3 most popular Excel topics on my desktop liberation site, namely the rest Excel Library, Mapping straight from Excel and d3.js integration with Excel.
This means I can track how often and other information about uses of any related module downloaded from my site. I hadn’t looked at it for a while, but because I’m now integrating it with similar tracking for Google Apps Script, I got back to it the other day. Here’s what I found.
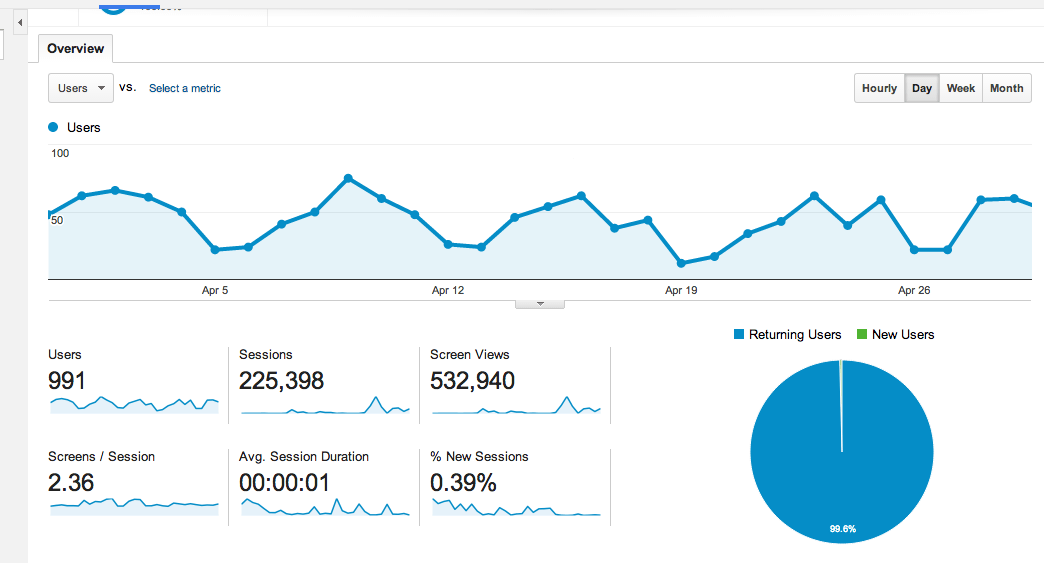
I have a steady about 75 people each working day, running these Excel libraries, presumably in apps that they’ve built – but an astonishing half a million executions in month. That means that this universe have executed this number of rest queries to an assortment of APIS (because that is by far the majority usage), generated maps or Earth visualisations from Excel, or created d3.js visualisations straight from Excel.
I’m constantly knocked out by the power of these kind of analysis tools. Universal Analytics measurement protocol is simply an amazing piece of work.