Last year, I started to experiment with Google Universal Analytics to measure usage of Excel Apps that people download from Excel Liberation in order to get insight into what’s being used, how it’s being used and to get insight into what improvements I could make to enhance performance, engagement and reach.
Here’s an update of what I’ve learned by instrumenting a small number of the functions called from downloaded workbooks. I’m using data from the past month in all these analyses. Of course you can opt out of the analytics instrumentation, so I don’t know what percentage of total usage is captured here.
Relating posts to increased usage
This shows the number of times daily that various versions of modules are being executed. I can see that a new version of cDataSet generated a lot of downloading and playing around in the past couple of weeks.
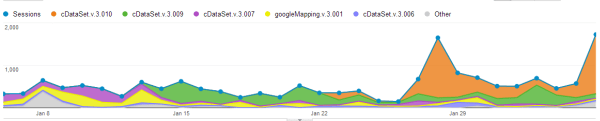
Just post something…
Looking back at my posts, I see that on Jan 27th there was a popular item comparing old and new Google Sheets, and on Feb 5th – another about a deaddrop capability for VBA. The thing is though, that the first was only about Google Docs and the second was about googleMapping – so the effect would be that small grey uptick on Feb 5th. So my conclusion here is that a post doesn’t necessarily generate activity directly related its topic, but does generate additional overall engagement..
Activity versus users
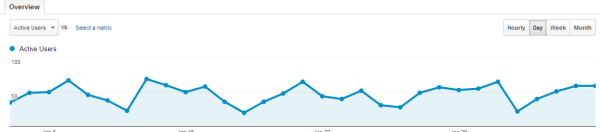
and get more engagement, not more users…
Since there is no apparent correlation between increased users and activity, the same people must be doing more things as a result of prompting from posts.Looking at the usage peak days a little more, I find that in both cases the most popular of the instrumented activities are servicing restQueries from Excel and generating sankey diagrams from Excel – which make up about 70% of all activity – about the same as the overall average for the month.
Performance
I can also check that performance on various versions is stable.
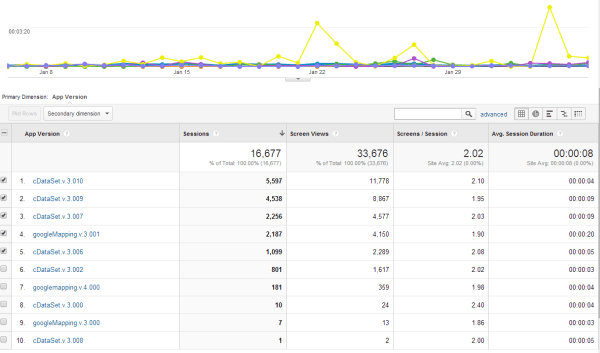
Here I can see that an average session is about 2 seconds. Typically that would be to process some excel data, create a rest query or web page, execute it, and process the results. I don’t see any performance concern trends, but there are a couple of anomalies with googleMapping on a couple of days; however the sample size is rather too small to read anything into it.
Locale
Looking at the geography of who is using what gives me a couple of surprises.
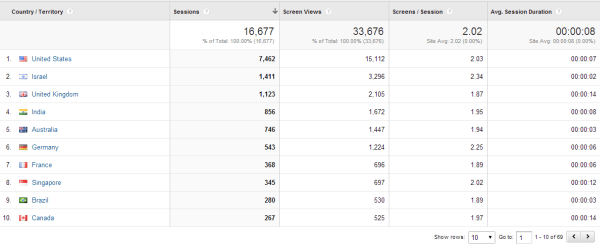

It doesn’t quite match the visitor profile to my site for the same period on the left.
If I was interested in commercializing this stuff, this would be valuable information for targetting. For example I can see lot’s of usage in Israel, Singapore and Brazil which I wouldn’t have known from looking at my site visitor profile.
These Universal Analytics are a great aid for making non web based apps more relevant, are a great aid in identifying what’s useful and being used.
For more on this, and how to instrument Excel for Universal Analytics, see Excel Liberation