What can you learn here?
- Using cRest
- Multiple sources
- Combining

Putting together multiple queries on same sheet get it now
So far we’ve been considering Rest queries to be discrete. In this section we are going to build a complete application that regularly collects data from multiple places and reports on it. Try it out first ? These are enhancements to Data Manipulation Classes so they have been included in cDataSet.xlsm, which is downloadable from Download Complete Projects.
Note
Tweetsentiments.com has withdrawn free access to it’s API. This example has been removed from the example workbook for now
Using tweets and sentiments to compare with stock price.
In this example we are going to take a look at how to query tweetsentiments, topsy and Google Finance on a scheduled basis, populate a spreadsheet with the results, and track changes over time. Starting from a stock ticker, we can look up the current stock price on Google Finance, use Tweetsentiments to see the sentiment at a point in time, and use topsy to count the moving average of tweets for a given day at a given time. These things together might (or might not) show a correlation between sentiment and stock price.
The combined table
Here is the combined table we are going to create at regular intervals. For this I’ve picked some random stocks to track. It’s a little hard to read, but I’ll take you through the details in the following sections. 
Google Finance
The first part of the process is to fill in a few pieces of data from a rest query to Google Finance, using the ticker as input. The current stock price is in the column marked ‘l’. 
Tweet sentiments
Next, we’ll take the current tweetsentiment using the ticker for each stock. It is standard practice to use $ticker on twitter when making stock price tweets. It may be that it’s worth querying on the company name as well to look for general sentiments about a company, but for this illustrative example, let’s use $ticker 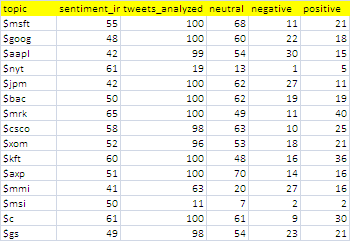
Topsy
We can use topsy to find out the volume of tweets on a particular, topic – in this case $ticker for each stock being tracked.
Adding a timestamp
We’ll add a timestamp to each row, so that we can analyze these over time later.
Scheduling and consolidation
Since we want to track this over time, we’ll automatically run this every now and again, and build up a backlog of data to create a chart over time, and refresh that with every update.
The Code
There is nothing new here that hasn’t been covered elsewhere in the Rest to Excel library, but here is how to put all this together. Run all the queries, move the collected data to a growing repository and update any charts.
Public Sub testandbucket()
testCombineFinanceSentiment
moveToBucket False
pivotCacheRefreshAll
End Sub
Execute the whole process and schedule the next one.
Public Sub scheduledbucket() testandbucket Schedulethebucket End Sub
Set up the next one to run in 20 minutes
Public Sub Schedulethebucket()
    Dim pn As Date
    pn = Now + TimeSerial(0, 20, 0)
    Application.OnTime pn, "scheduledbucket"
End Sub
Do all the queries, and add a timestamp. The definition of the queries have all been added to the Rest to Excel library. Note that there is not much work to do here since all the nasty bits are mainly handled by the Data Manipulation Classes
Public Function testCombineFinanceSentiment() As cRest
    Dim dr As cDataRow, cc As cCell, cr As cRest, t As Date
    'get the ticker data
    generalReport restQuery _
        ("investbysentiments", "google finance", , "ticker", , , , , False) _
        , False
    'add the tweet sentiments
    Set cr = generalReport(restQuery _
        ("investbysentiments", "tweetsentiment topics", , "topic", , , , , False) _
        , False)
    'add the topsy counts
    Set cr = generalReport(restQuery _
        ("investbysentiments", "topsy count", , "topic", , , , , False) _
        , False)
    t = Now()
    With cr.dSet.Column("timestamp")
         For Each cc In .Rows
            cc.Value = t
         Next cc
    End With
    cr.dSet.bigCommit
End Function
After each scheduled query set, the collected data is moved to a repository for later analysis. Again, the Data Manipulation Classes do most of the dirty work.
Private Sub moveToBucket(Optional bCleanAfter As Boolean = True)
    Dim ds As cDataSet, dsb As cDataSet, w As Range
    Set ds = New cDataSet
    ' get the currently populated stuff
    With ds
        .populateData wholeSheet("investbysentiments"), , , , , , True
    End With
    ' get the current bucket
    Set dsb = New cDataSet
    With dsb
        .populateData wholeSheet("investbysentimentsbucket"), , , , , , True
    ' assume columns are all the same and just to a big commit
        Set w = .where
        If w Is Nothing Then
            Set w = .HeadingRow.where.Offset(1)
        Else
            Set w = .where.Offset(.Rows.Count)
        End If
        ds.bigCommit w.Resize(1, 1), , , , , , False
        If bCleanAfter Then
            ds.where.ClearContents
        End If
    End With
    Set ds = Nothing
    Set dsb = Nothing
End Sub
Refreshing any pivot caches will update any associated pivots and charts
Sub pivotCacheRefreshAll()
    Dim pc As PivotCache
    Dim ws As Worksheet
    With ActiveWorkbook
        For Each pc In .PivotCaches
            pc.Refresh
        Next pc
    End With
End Sub
Since we want this to be automatic, we will use a named Dynamic range for the reporting pivot table and chart, defined as follows.
=OFFSET(InvestBySentimentsBucket!$A$1,0,0, COUNTA(InvestBySentimentsBucket!$A:$A), COUNTA(InvestBySentimentsBucket!$1:$1))
Tracking chart
The tracking chart looks like this

Summary
Note that this is an example to illustrate the technique – not a research project – maybe you could use the tools here and devise something more scientific. If you do find a correlation, we’d love to hear about it on the ramblings forum. Occasionally you will get some error like ‘forbidden – rate limit exceeded’ – since the access to topsy and tweetsentiments are sometimes throttled. This can likely be fixed by waiting a moment between each query. I haven’t experimented with that yet for the purposes of this example.
If you find this useful and want to contribute any examples or improvements, or would like something considered for publication on this site, please contact me at the ramblings forum
These are enhancements to Data Manipulation Classes so they have been included in cDataSet.xlsm, which is downloadable from Download Complete Projects.
Continue reading about REST to Excel Library