Deprecated
Google has now stopped its Earth API and Maps API is a paid for API nowadays. Some capabilities have also been either removed or changed. Therefore, I had to remove all examples of VizMap applications I had created. I didn’t remove the entire topic as I thought some of the code may still be useful with some modifications.
Plotting markers on on a Google Earth
This article will cover how to create a basic KML file so that your Excel data can be mapped on Google Earth. There is a more advanced implementation in Data Driven Mapping applications which can plot complex google visualizations on top of either Google Maps or Google Earth right out of Excel.
Try it out first ?
If you just want a to try it, then you can download an example application (googleMapping.xlsm) and come back here later. Note that you may want modify the filenames for the output files to some directory that suits you before running. These filenames can be found in the GeoCoding Worksheet and look like this – just change the ‘Code’ Column for filename in ther Marker KML parameter block to something appropriate for your PC.
Some directories on your machine may be readonly to you – for example if you have downloaded this and run it from the download directory on windows 8 you may not be able to create a file in that directory because of local permission settings. You should set this to a directory you have permission to create files in.
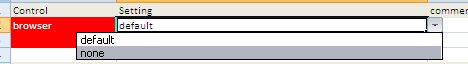
Note also that by default, a session of Google Earth (or whatever you have associated with the kml suffix), will kick off after generation of the file. You can change this behavior in the control parameter block by setting the browser to ‘none’ if you only want to create the file and not execute it.
Quick start
- Download the Google Maps workbook
- Amend Columns A,B,C in the VenueMaster workbook to your data
- Hit one of the buttons on that page to geocode (with Google, Bing, yahoo , create a KML file or plot the addresses on a map using Google, Yahoo, Bing or OVI.
- Read how it works below. You will normally not need to do any coding – just possible tweak a parameter sheet. For example here is all that is needed to Plot addresses on a google map or a Bing Map, where the argument is the name of a parameter sheet.
Public Sub bingMarkingVizVenues()
    bingMarkingExample cVizAppVenues
End Sub
Public Sub googleMarkingVizVenues()
    googleMarkingExample cVizAppVenues
End Sub
What is KML
KML is a markup language for describing how to display geographic data to Google Earth and other great resources. Just as we can map your data to google maps straight of Excel, we can do the same with Google Earth or other KML capable systems by generating a simple KML file. The process is no different and the VBA code just as simple as with the mapping solutions.
Here’s what you get –
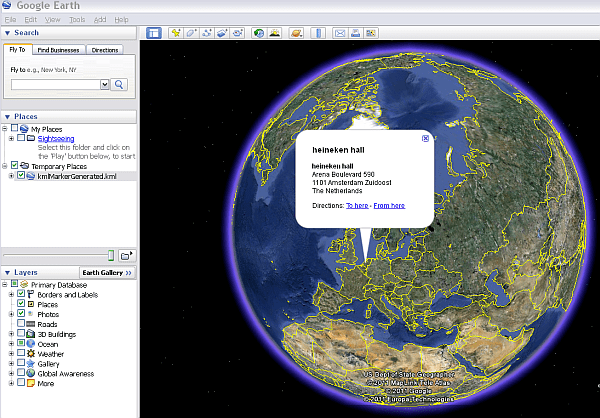
and here is what a generated KML file looks like.
<?xml version='1.0' encoding='UTF-8'?>
<kml xmlns='http://www.opengis.net/kml/2.2'>
<Document>
<Placemark>
<name>
Rosemount theatre
</name><description>
<![CDATA[<b>Rosemount theatre</b><br>Rosemont Theater<br> 5400 N River Rd<br> Rosemont<br> IL 60018-5409<br> USA<br>]]>
</description><Point>
<coordinates>
-87.86369,41.976641
</coordinates>,0
</Point>
</Placemark><Placemark>
<name>
UNO Lakefront Arena
</name><description>
<![CDATA[<b>UNO Lakefront Arena</b><br>6801 Franklin Ave<br> New Orleans<br> LA 70122<br> USA<br>]]>
</description><Point>
<coordinates>
-90.0522531,30.029015
</coordinates>,0
</Point>
</Placemark><Placemark>
<name>
Intex
</name><description>
<![CDATA[<b>Intex</b><br>?559-0034<br> Japan<br>]]>
</description><Point>
<coordinates>
135.4253848,34.6381228
</coordinates>,0
</Point>
</Placemark><Placemark>
<name>
olympic park
</name><description>
<![CDATA[<b>olympic park</b><br>Olympic Park<br> 88 Bangi-dong<br> Songpa-gu<br> Seoul<br> South Korea<br>]]>
</description><Point>
<coordinates>
127.1227901,37.5198209
</coordinates>,0
</Point>
</Placemark><Placemark>
<name>
aktiv square
</name><description>
<![CDATA[<b>aktiv square</b><br>Ban Mai<br> Bang Yai<br> Nonthaburi 11140<br> Thailand<br>]]>
</description><Point>
<coordinates>
100.3610179,13.8448335
</coordinates>,0
</Point>
</Placemark><Placemark>
<name>
red square
</name><description>
<![CDATA[<b>red square</b><br>Red Square<br> Moscow<br> Russia<br>]]>
</description><Point>
<coordinates>
37.6215052,55.7532225
</coordinates>,0
</Point>
</Placemark><Placemark>
<name>
heineken hall
</name><description>
<![CDATA[<b>heineken hall</b><br>Arena Boulevard 590<br> 1101 Amsterdam Zuidoost<br> The Netherlands<br>]]>
</description><Point>
<coordinates>
4.9441509,52.3123574
</coordinates>,0
</Point>
</Placemark>
</Document></kml>
VBA walkthrough
We normally use jSon to communicate with mapping packages, but since kml is xml based we need different approach to formatting the output data. Aside from this there is no difference in the code to that point.
Since this application is generic and data driven, we simply need to pass the name of the parameter sheet for the particular dataset to the generic marking module, and let it know that we are in this case going to need KML output rather than an HTML file complete with generated javaScript.
Public Sub KMLMarkingVizVenues()
    KMLMarkingExample cVizAppVenues
End Sub

Public Sub KMLMarkingExample(paramName As String)
    ' turns out these are all the same except for the paramer block to use
    genericMarking paramName, cMarkerKML, eOutputKML
End Sub
The only difference in the generic Marking module is to call a different outputfile generator
fName = dSets.DataSet(markerHtml).Cell("filename", "code").toString
    Select Case eOutput
        Case eOutputHtml
            If openNewHtml(fName, _
                    generateHtml(job, dSets, markerHtml)) Then
                pickABrowser dSets, fName, True
            End If

        Case eOutputKML
            If openNewHtml(fName, generateKML(job, dSets)) Then
                pickABrowser dSets, fName, True
            End If

        Case Else
            Debug.Assert False

    End Select
Which is the trivial conversion exercise below
Private Function generateKML(job As cJobject, dSets As cDataSets) As String
    Dim s1 As String
    Dim jo As cJobject

    s1 = vbNullString
    For Each jo In job.Children
        s1 = s1 & generatePlaceMark(jo)
    Next jo

    generateKML = _
         "<?xml version='1.0' encoding='UTF-8'?>" & vbLf & _
         "<kml xmlns='http://www.opengis.net/kml/2.2'>" & vbLf & _
         tag("Document", s1) & "</kml>"


End Function

Private Function generatePlaceMark(job As cJobject) As String
    ' convert jSon item to KML
    With job
        generatePlaceMark = _
            tag("Placemark", _
            tag("name", .Child("title").toString) & _
            tag("description", _
            "<![CDATA[" & .Child("content").toString & "]]>") & _
            tag("Point", _
                tag("coordinates", .Child("lng").toString & "," & _
                    .Child("lat").toString) & ",0"))
    End With
End Function
Private Function tag(tagName As String, _
            Optional item As String = vbNullString) As String
    tag = "<" & tagName & ">" & vbLf & _
                item & vbLf & "</" & tagName & ">"

End Function
This is of course only scratching the surface of the capabilities of Google Earth. Check back here for more interesting KML/ Excel integration or take a look at Data Driven Mapping applications for how to create mapping applications straight out of Excel with no javaScript to write.
For help and more information join our forum, follow the blog, follow me on Twitter