Lets say that we want to create a circular color ramp, as used in How to create a heatmap doughnut chart, as in the example shown on the right

This is actually 2 steps, using this data
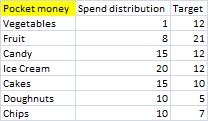
- Use the values for each category to create target colors. For example, “ice cream” has the highest spend in the first category, whereas “fruit” has the highest in the second. The target colors for each category midpoint are calculated using these values, meaning that “ice cream, category 1” gets a slightly less intense color than “fruit, category 2” and so on.
- Now we have to calculate the color ramp for intermediate steps between each of these midpoints. Since the color ramp library provides the capability to pass custom colors, we can simply use the midpoint colors created in step 1 to generate a colorramp between them.
Here are the calculated colors
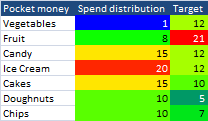
So the task is now to calculate a smooth transition between each of these colors and to circle back from Chips to Vegetables, where each transition is centered around the calculated color for each category, as below
![]()
Here is the snippet for that
' and the target colors based on the values
 For j = LBound(aColors, 2) To UBound(aColors, 2)
   For i = 1 To ds.rows.count
    aColors(i + 1, j) = _
      rampLibraryRGB(colorRampName, mn, mx, ds.value(i, j), brighten)
   Next i
' for cycling - add the last color at beginning and first color at end
   aColors(1, j) = aColors(1 + ds.rows.count, j)
   aColors(2 + ds.rows.count, j) = aColors(2, j)
 Next j
Since each slice of the doughnut is now of equal size, (remember we are using color instead of size to show intensity), the color of each slice is calculated by its relative position along this circular scale, as per the snippet below
 ' dealing with this point
   o = (i - 1) * granularity + j + 1
' note we are already half a granularity along with 1st point
  props = makeColorProps(colorRamp _
    (1, (granularity * (ds.rows.count + 1)), o + granularity / 2, _
           extractArrayItem(aColors, k)))
Here’s the complete code for the module that creates the chart.
For help and more information join our forum, follow the blog or follow me on twitter .