This isn’t an add-on yet (although I may get round to making it into one), but it can be used by taking a copy of the script and running it in test add-on mode. I simply used stuff I already had, notably Configurable canvas meter and polling code from my other add-ons, so it was a trivial task to put it all together.
What is it
Not much for now actually, It just polls a server function which returns the data on the latest sheet, but it measures how long each part of the journey took. I’m reporting on roundtrip time broken down into transport time (how long it took to pass back and forwards the request), and execution time (how long the server part took to execute). I may add more stuff at some point.
The reporting
It looks like this and shows in real time over a repeated polling interval, how long it takes for html service running as an add-on takes to get a response to a request – in this initial proof of concept case, it simply reads and returns the active sheet data. 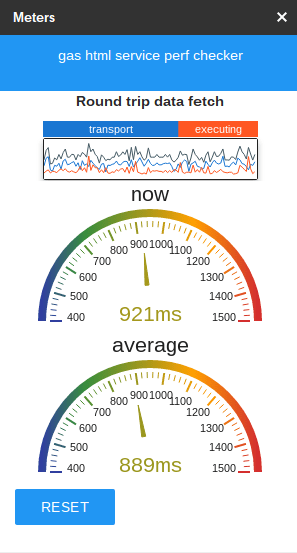
How to run it
☑Get the script and make a copy.
☑Publish as test as an add-on and associate it with some sheet
☑Run it from the add-on menu
Where is it
What’s next
I may extend it to collect and report on other stuff, and possibly publish it as a proper add-on, depending on how useful people find it to be.
Subpages
- Chord Snip
- Color Arranger
- Debugging Office JavaScript API add-ins
- Dicers
- Dicers Pro and advanced features
- Merging slide templates with tabular data
- Office Add-ins – first attempt
- Orchestrating competing google and Office framework loads
- Plotting maps with overlays Sheets add-on starter
- Promise implementation for Apps Script Stripe payments
- Repeatable add-on settings layouts and style
- Sheets API – Developer Metadata
- SlidesMerge add-on
- Unpicking the Google Picker
- Watching for changes in an Office add-in
- When test add-ons doesn’t work
- Polyfill for Apps Script properties service for the Office JavaScript API
- Sankey Snip